
Revenue
The revenue chart displays the total revenue earned from both subscriptions and one-time purchases, minus the revenue that was refunded later. The Revenue chart is an essential tool to monitor the financial performance of the app.
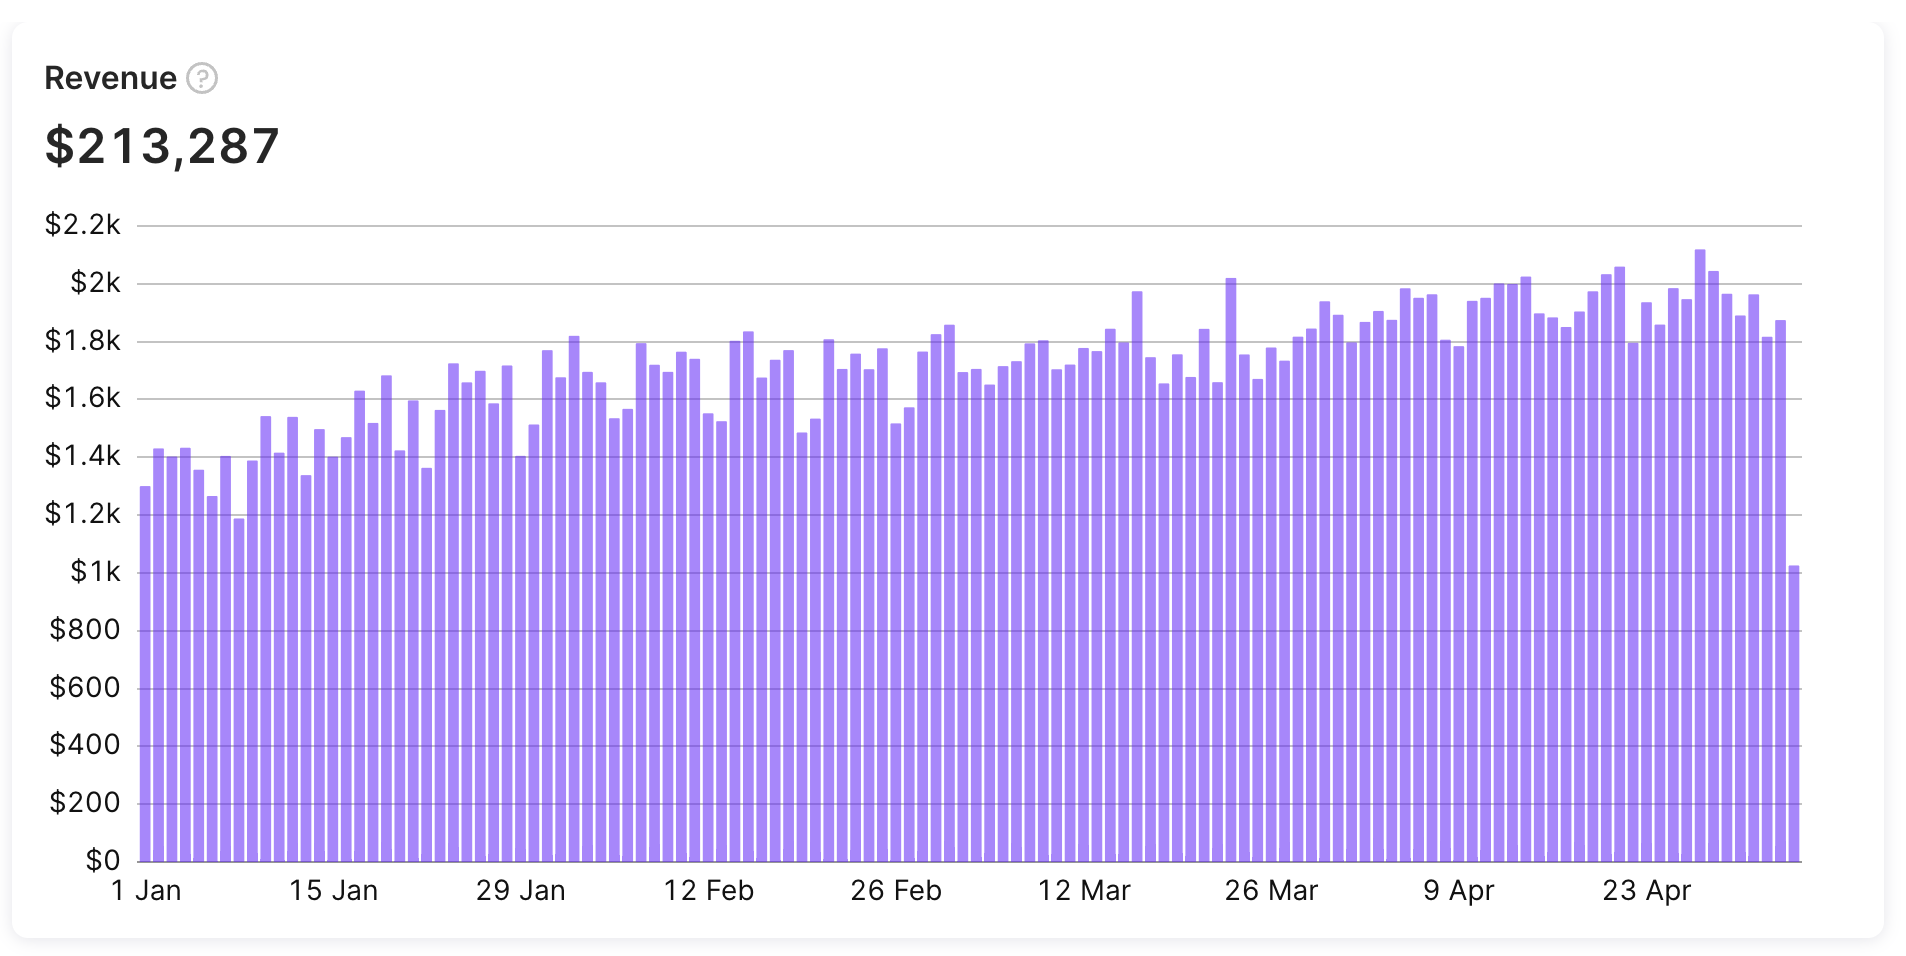
Revenue chart
Calculation
The Adapty revenue chart calculates the total revenue generated by the app minus the refunded revenue. This includes both new revenue, which comes from a customer's first paid transaction, such as new paid subscriptions, initial non-consumable and consumable purchases, and trial-to-paid conversions, as well as renewal revenue, which comes from subsequent paid transactions such as paid subscription renewals, promotional offers for existing subscribers, additional non-renewing subscription purchases, and more.
The calculation is done before deducting the store's fees and taxes. Revenue from each transaction is attributed to the period in which the transaction occurred, which can lead to period-over-period fluctuations based on the mix of subscription durations being started or renewed. It's important to note that refunds are treated as negative revenue and attributed to the day they occurred on (not to the day the subscription began).
Revenue = Total amount billed to customers - Revenue from refunded purchases/subscriptions.
For example, there were 5 monthly $10 subs, 1 yearly $100 sub, and 10 one-time $50 purchases today,
revenue = 5$10 + 1$100 + 10*$50 = $650
After calculating the total revenue earned from in-app purchases, Adapty's Revenue chart provides an estimate of the expected proceeds by deducting the store's commission fee and taxes. The commission fee is calculated based on the gross revenue, while taxes are deducted before the commission fee is applied. This ensures that the displayed proceeds reflect the net revenue received by the app after accounting for both the store's commission and applicable taxes. To learn more about how Adapty calculates commission fees, taxes, and estimates the expected proceeds, refer to the relevant documentation.
Available filters and grouping
- ✅ Filter by: Attribution, country, paywall, store, product, and duration.
- ✅ Group by: Renewal status, period, product, country, store, paywall, duration, attribution status, attribution channel, attribution campaign, attribution ad group, attribution ad set, and attribution creative.
You can find more information about the available controls, filters, grouping options, tax and commission controls, and how to use them in this documentation.
Revenue chart usage
The Revenue chart is a valuable tool to track the financial performance of the app. By analyzing the chart's data, you can gain insight into the growth trajectory of your app over time. One useful approach is to switch to a monthly resolution and observe the last 12 months of revenue to assess the app's overall trend. It is also helpful to analyze the mix of new and renewal revenue to identify where growth is coming from. You can further segment the data by different dimensions, such as product or user type, to gain deeper insights into the app's financial performance. Overall, the Revenue chart is an essential metric for understanding the financial health of an app and optimizing its revenue strategy.
Similar metrics
In addition to Revenue, Adapty also provides metrics for other revenue-related events, such as MRR, ARR, ARPU, and ARPPU. To learn more about these revenue-related metrics, please refer to the following documentation guides:
Updated 12 days ago