
A/B test results and metrics
Discover important data and insights from our A/B tests, comparing different paywalls to see how they affect user behavior, engagement, and conversion rates. By looking at the metrics and results here, you can make smart choices and improve your app's performance. Dive into the data to find actionable insights and enhance your app's success.
A/B test results
Here are three metrics that Adapty provides for A/B test results:
Revenue: The revenue metric represents the total amount of money generated in USD from purchases and renewals. It includes both the initial purchase and subsequent subscription renewals. This metric helps you evaluate the financial performance of each A/B test variant and determine which option generates the highest revenue.
Probability to be best: Adapty utilizes a robust mathematical analysis framework to analyze A/B test results and provides a metric called Probability to be best. This metric assesses the likelihood that a particular variant is the best-performing option (in terms of its long-term revenue) among all the variants tested. The metric is expressed as a percentage value ranging from 1% to 100%. For detailed information on how Adapty calculates this metric, please refer to the documentation.The best performing option, determined by Revenue per 1K user, is highlighted in green and automatically selected as the default choice.
Revenue per 1K users: The revenue per 1K users metric calculates the average revenue generated per 1,000 users for each A/B test variant. This metric helps you understand the revenue efficiency of your variants, regardless of the total number of users. It allows you to compare the performance of different variants on a standardized scale and make informed decisions based on revenue generation efficiency.
Prediction intervals for revenue 1K users: The revenue per 1K users metric also includes prediction intervals. These prediction intervals represent the range within which the true revenue per 1,000 users for a given variant is predicted to fall based on the available data and statistical analysis.
In the context of A/B testing, when analyzing the revenue generated by different variants, we calculate the average revenue per 1,000 users for each variant. Since revenue can vary among users, the prediction intervals provide a clear indication of the plausible values for the revenue per 1,000 users, taking into account the variability and uncertainty associated with the prediction process.
By incorporating prediction intervals into the revenue per 1K users metric, Adapty enables you to assess the revenue efficiency of your A/B test variants while considering the range of potential revenue outcomes. This information helps you make data-driven decisions and optimize your subscription strategy effectively, by taking into account the uncertainty in the prediction process and the plausible values for revenue per 1,000 users.
By analyzing these metrics provided by Adapty, you can gain insights into the financial performance, statistical significance, and revenue efficiency of your A/B test variants, enabling you to make data-driven decisions and optimize your subscription strategy effectively.
A/B test metrics
Adapty provides a comprehensive set of metrics to help you effectively measure the performance of your A/B test conducted on your paywall variations. These metrics are continuously updated in real-time, except for views, which are updated periodically. Understanding these metrics will help you assess the effectiveness of different variations and make data-driven decisions to optimize your paywall strategy.
A/B test metrics are available on the A/B test list, where you can gain an overview of the performance of all your A/B tests. This comprehensive view offers aggregated metrics for each test variation, enabling you to compare their performance and identify significant differences. For a more detailed analysis of each A/B test, you can access the A/B Test detail metrics. This section provides in-depth metrics specific to the selected A/B test, allowing you to delve into the performance of individual variations.
All metrics, except for views, are attributed to the product within the paywall.
Metrics controls
The system displays the metrics based on the selected time period and organizes them according to the left-side column parameter with three levels of indentation.
Profile install date filtration
Profile install date filtration for A/B test metrics
The Filter metrics by install date checkbox enables the filtering of metrics based on the profile install date, instead of the default filters that use trial/purchase date for transactions or view date for paywall views. By selecting this checkbox, you can focus on measuring user acquisition performance for a specific period by aligning metrics with the profile install date. This option is useful for customizing the metrics analysis according to your specific needs.
Time ranges
You can choose from a range of time periods to analyze metrics data, allowing you to focus on specific durations such as days, weeks, months, or custom date ranges.
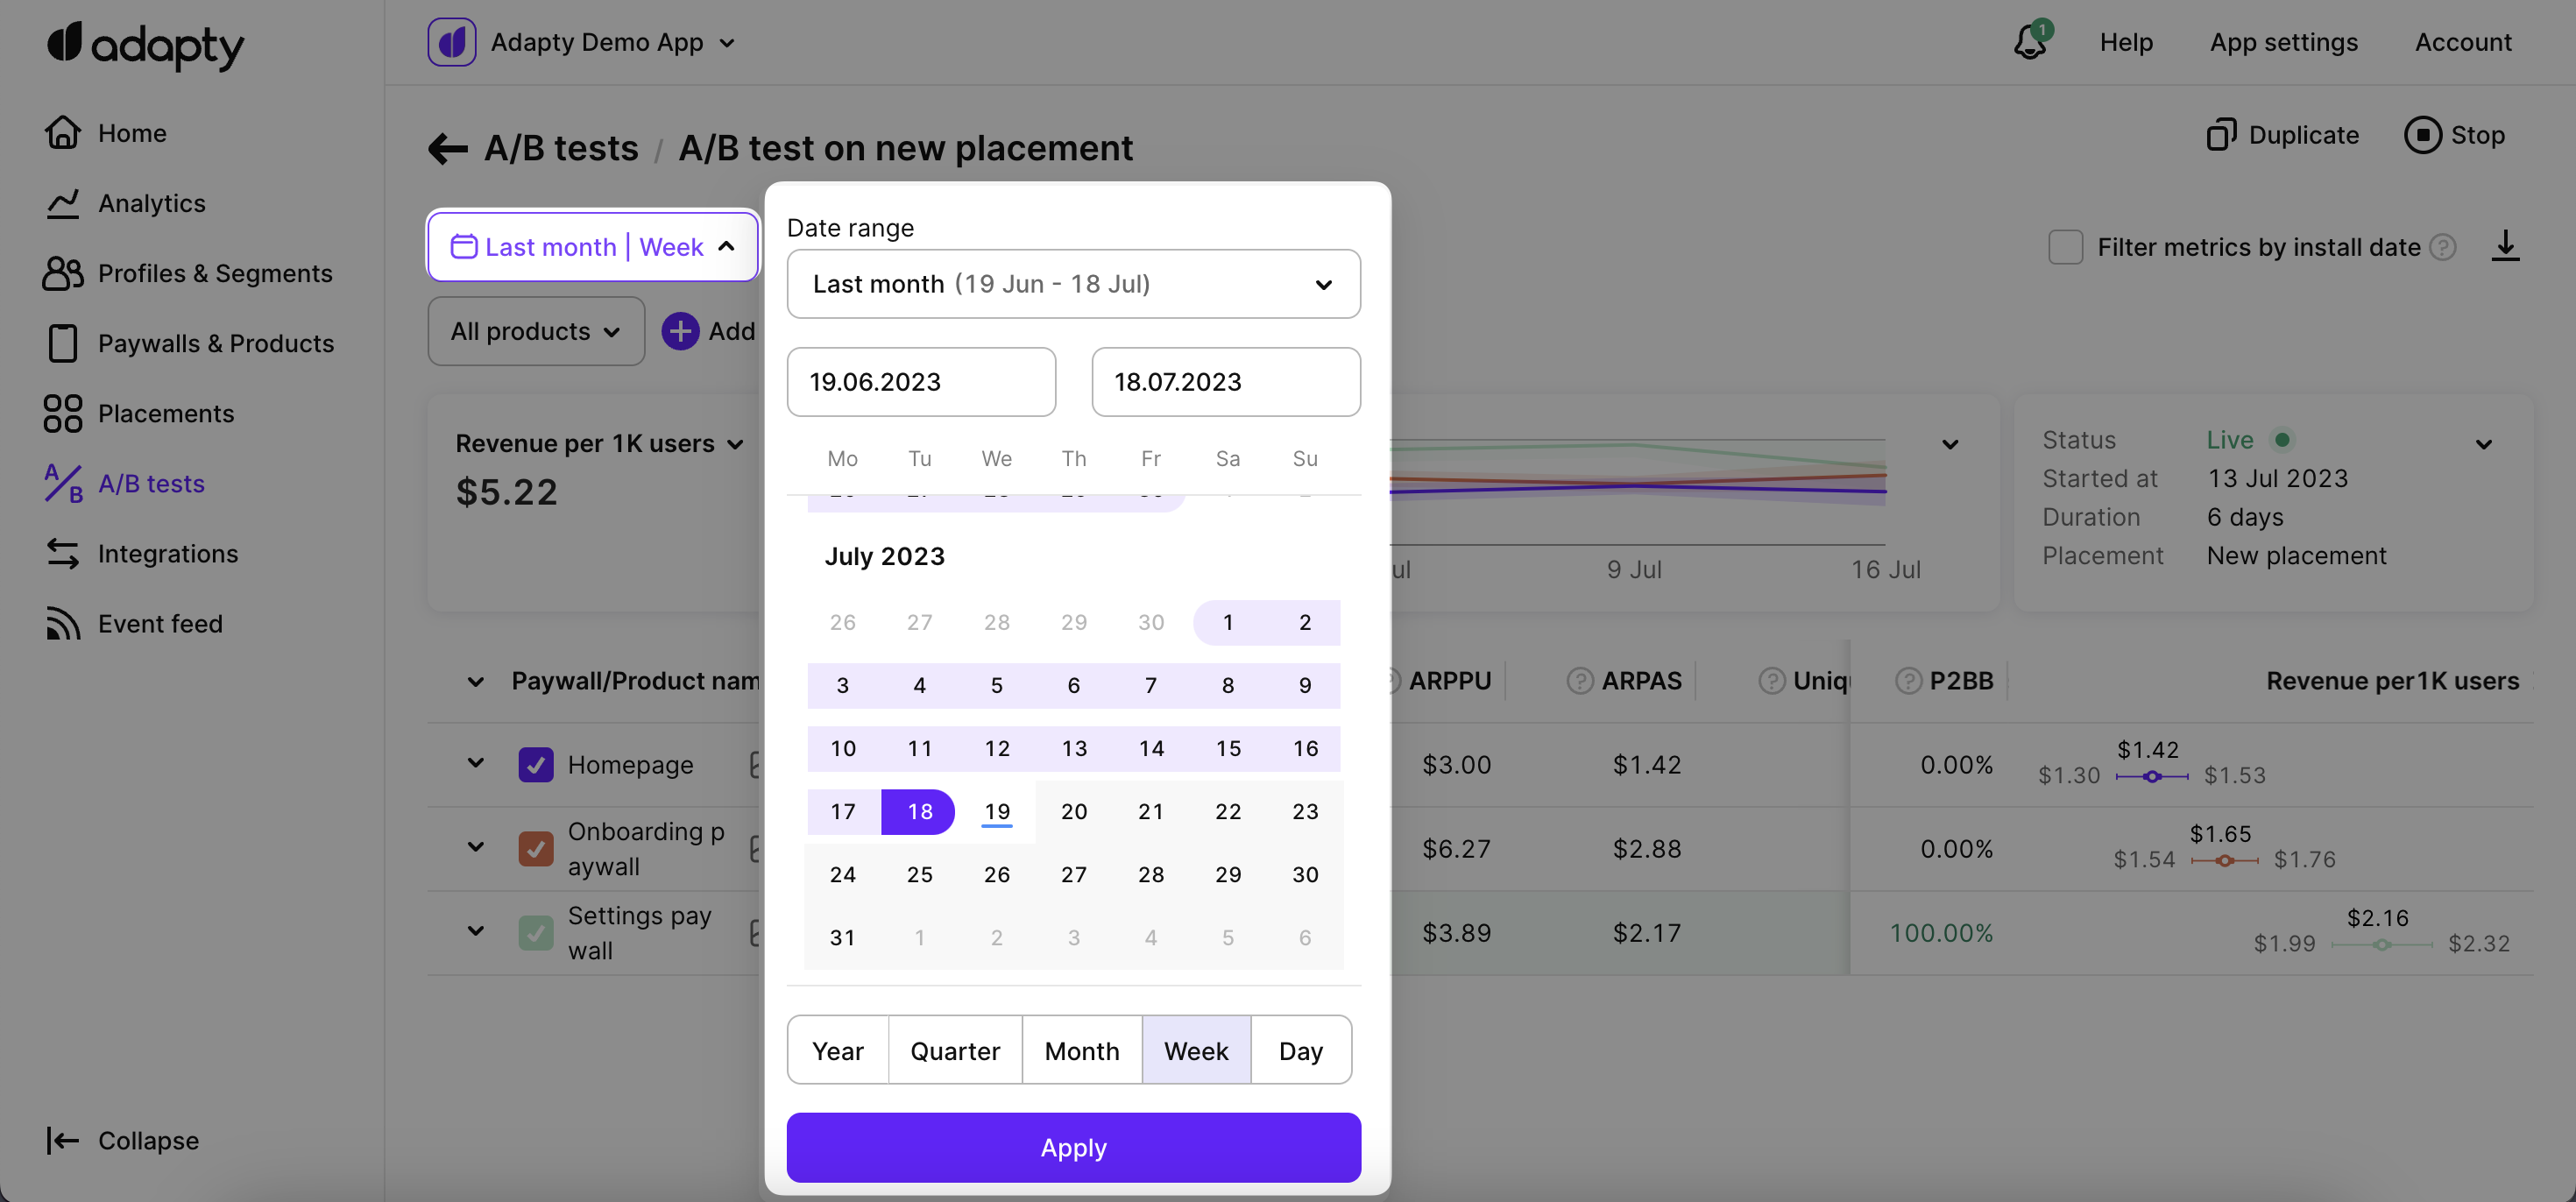
Time range filtering for A/B test metrics
Available filters and grouping
Adapty offers powerful tools for filtering and customizing metrics analysis to suit your needs. With Adapty's metrics page, you have access to various time ranges, grouping options, and filtering possibilities.
- ✅ Filter by: Audience, country, paywall, paywall state, paywall group, placement, country, store, product, and product store.
- ✅ Group by: Product and store.
You can find more information about the available controls, filters, grouping options, and how to use them for paywall analytics in this documentation.
Single metrics chart
One of the key components of the paywall metrics page is the chart section, which visually represents the selected metrics and facilitates easy analysis.
Single metrics chart for A/B test
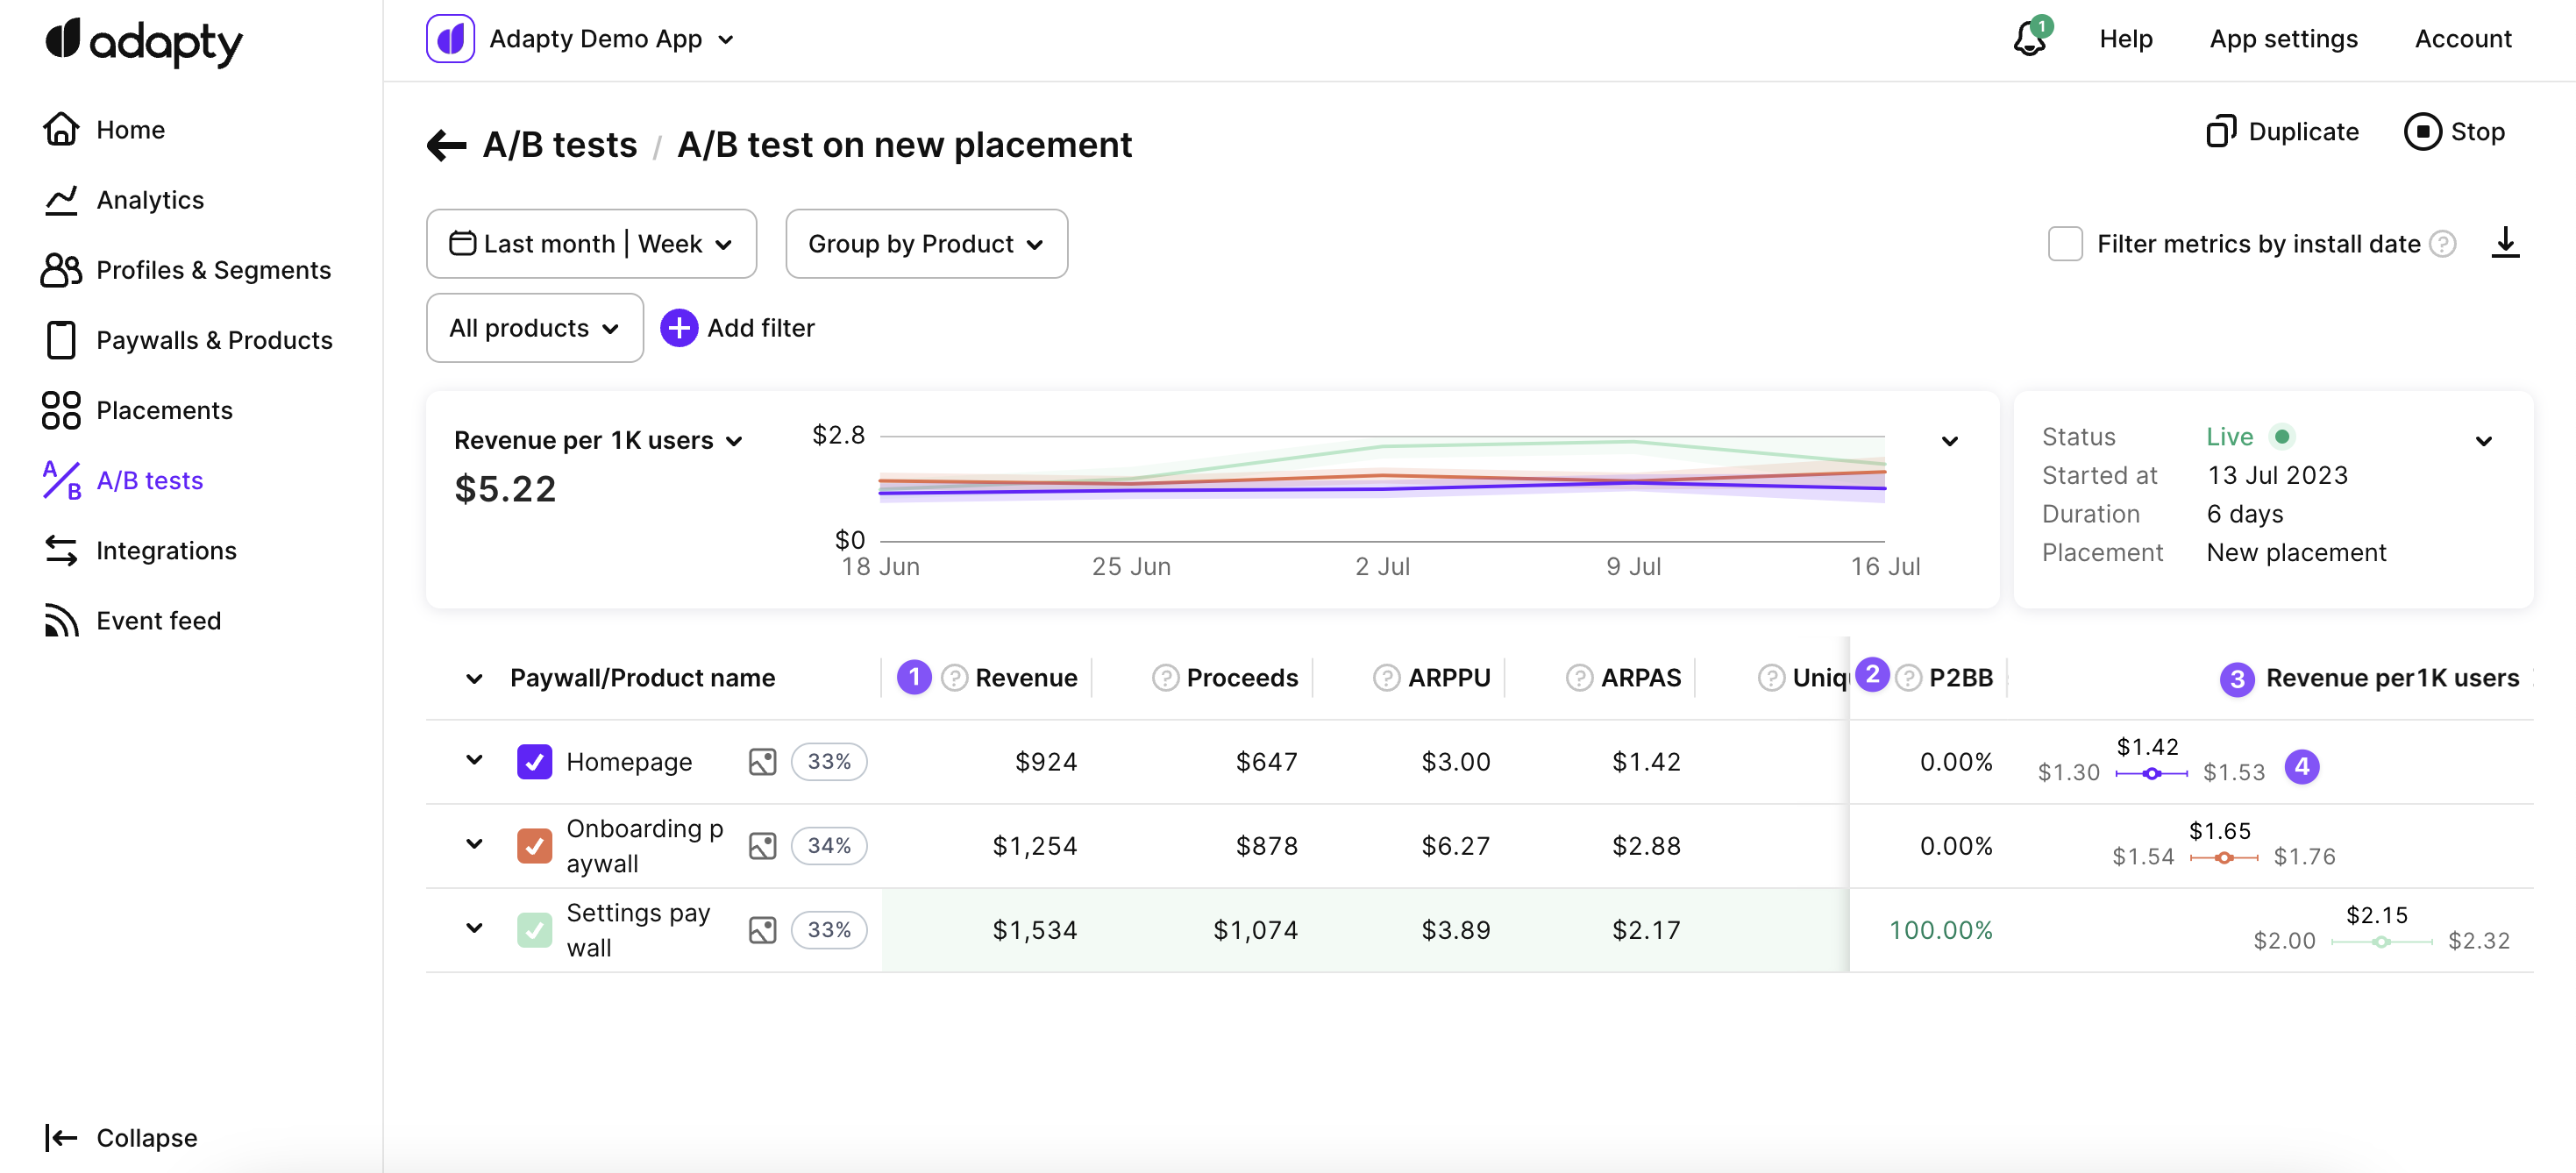
The chart section on the A/B test metrics page includes a horizontal bar chart that visually represents the chosen metric values. Each bar in the chart corresponds to a metric value and is proportional in size, making it easy to understand the data at a glance. The horizontal line indicates the timeframe being analyzed, and the vertical column displays the numeric values of the metrics. The total value of all the metric values is displayed next to the chart.
Additionally, clicking on the arrow icon in the top right corner of the chart section expands the view, displaying the selected metrics on the full line of the chart.
A/B test summary
Next to the single metrics chart, the A/B test details summary section is displayed, which includes information about the state, duration, placements, and other related details about the A/B test.
A/B test details
Metrics definitions
Here are the key metrics that are available for the A/B tests:
A/B test metrics
Revenue
Revenue represents the total amount of money generated in USD from purchases and renewals resulting from the A/B test. It includes the initial purchase and subsequent subscription renewals. The revenue metric is calculated before deducting the App Store or Play Store commission.
CR to purchases
The conversion rate to purchases measures the effectiveness of your A/B test in converting views into actual purchases. It is calculated by dividing the number of purchases by the number of views. For example, if you had 10 purchases and 100 views, the conversion rate to purchases would be 10%.
CR trials
The conversion rate (CR) to trials is the number of trials started from A/B test divided by the number of views. Conversion rate to trials measures the effectiveness of your A/B test in converting views into trial activations. It is calculated by dividing the number of trials started by the number of views.
Purchases
The purchases metric represents the total number of transactions made within the paywall resulting from the A/B test. It includes the following types of purchases:
- New purchases made on the paywall.
- Trial conversions of trials that were activated on the paywall.
Downgrades, upgrades, and cross-grades of subscriptions on the paywall. - Subscription restores on the paywall (e.g. when a subscription is expired without auto-renewal and is subsequently restored).
Please note that renewals are not included in the purchases metric.
Trials
The trials metric indicates the total number of activated trials resulting from the A/B test.
Trials cancelled
The trials canceled metric represents the number of trials in which auto-renewal has been switched off. This occurs when users manually unsubscribe from the trial.
Refunds
Refunds for the A/B test represent the number of refunded purchases and subscriptions specifically related to the tested paywall variations.
Views
Views are the number of views of the paywalls that the A/B test consits of. If the user visits the paywalls two times, this will be counted as two visits.
Unique views
Unique views are the number of unique views of the paywall. If the user visits the paywall two times, this will be counted as one unique view.
Probability to be the best
The Probability to be the best metric quantifies the likelihood that a specific paywall variant within an A/B test is the top-performing option among all the tested paywalls. It provides a numerical probability indicating the relative performance of each paywall. The metric is expressed as a percentage value ranging from 1% to 100%.
ARPPU (Average revenue per paying user)
ARPPU stands for Average Revenue Per Paying User resulting from the A/B test. It is calculated as the total revenue divided by the number of unique paying users. For example, if you have generated $15,000 in revenue from 1,000 paying users, the ARPPU would be $15.
ARPAS (Average revenue per active subscriber)
ARPAS is a metric that allows you to measure the average revenue generated per active subscriber from running the A/B test. It is calculated by dividing the total revenue by the number of subscribers who have activated a trial or subscription. For example, if the total revenue is $5,000 and you have 1,000 subscribers, the ARPAS would be $5. This metric helps assess the average monetization potential per subscriber.
Proceeds
The proceeds metric for the A/B test represents the actual amount of money received by the app owner in USD from purchases and renewals after deducting the applicable App Store / Play Store commission. It reflects the net revenue specifically associated with the paywall variations tested in the A/B test, contributing directly to the app's earnings. For more information on how proceeds are calculated, you can refer to the Adapty documentation.
Unique subscribers
The unique subscribers metric represents the count of distinct individuals who has subscribed or activated a trial through the paywall variations in the A/B test. It considers each subscriber only once, irrespective of the number of subscriptions or trials they initiate.
Unique paid subscribers
The unique paid subscribers metric represents the number of unique individuals who have successfully completed a purchase and become paying subscribers through the paywall variations in the A/B test.
Refund rate
The refund rate for the A/B test is calculated by dividing the number of refunds specifically associated with the paywall variations in the test by the number of first-time purchases (renewals are excluded). For instance, if there are 5 refunds and 1000 first-time purchases, the refund rate would be 0.5%.
Unique CR purchases
The unique conversion rate to purchases for the A/B test is calculated by dividing the number of purchases specifically associated with the paywall variations in the test by the number of unique views. For example, if there are 10 purchases and 100 unique views, the unique conversion rate to purchases would be 10%.
Unique CR trials
The unique conversion rate to trials for the A/B test is calculated by dividing the number of trials started specifically associated with the paywall variations in the test by the number of unique views. For example, if there are 30 trials started and 100 unique views, the unique conversion rate to trials would be 30%.
Updated 3 months ago