
Predictions in A/B tests
Welcome to the Adapty Predictive Analytics documentation for our A/B testing feature. This tool will provide insights into the future results of your running A/B Tests and help you make data-driven decisions faster 🚀 with Adapty's ML-powered predictions.
A/B test winner predictions are only available on Pro+ and Enterprise plans
What are A/B test predictions?
Adapty's A/B Test Predictions employ advanced machine learning techniques (specifically gradient boosting models) to forecast the long-term revenue potential of the paywalls that are compared in an A/B test.
This predictive model enables you to select the most effective paywall based on projected revenue after a year, instead of relying only on the metrics you observe while the test is running. This allows you decide on the winner more reliably and faster, without having to wait weeks for the data to accumulate.
How does the model work?
The model is trained on extensive historical A/B test data from a variety of apps in different categories. It incorporates a wide range of features to predict the revenue a paywall is likely to generate in a year after the experiment start. These features include:
- User transactions and conversion rates over different periods
- Geographic distribution of users
- Platform usage (iOS or Android)
- Opt-out and refund rates
- Subscription products and their period lengths (daily, monthly, yearly and so on)
- Other transaction-related data
The model also accounts for trial periods in paywalls, using historical conversion rates to predict revenue as if users were already converted. This ensures a fair comparison between paywalls with and without trial offers, because we will also account for active trials potentially bringing in revenue in the future.
How is Predicted P2BB different from just the P2BB?
Our A/B tests utilise the Bayesian approach: basically we model the distribution of the revenue per user (or “Revenue per 1K users” to be specific) and then calculate the probability that one distribution is “truly” better than the other one and not by a random chance — and this is what we call the Probability-to-be-the-best or P2BB (you can learn more about our approach here).
It’s important to note that while doing so, we only rely on the revenue that has been accumulated over the time the test has been running. So if you were to run a test comparing a yearly subscription to a weekly one, you would have to wait a really long time to truly understand what performs better. A similar thing happens when you compare trial subscriptions with non-trial subscriptions in an A/B test — as the active trials that could potentially shift the winner dynamics are always unaccounted for in the revenue.
This is where our predictive model comes into play. Having the current revenue distribution in an A/B test and trained on a large dataset it’s able to predict the future version of the revenue distribution (namely after 1 year). And after doing so, it produces a predicted P2BB — the one that you would arrive at if you were to run the test for the entire year.
Note that sometimes predicted P2BB can contradict the current P2BB. When that's the case, we highlight the variation rows with yellow like so:
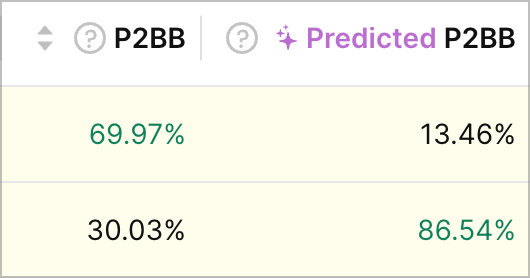
We consider that a signal that you should accumulate more data to confirm the winner or dig deeper into the A/B test to find out the reason behind it. Generally we recommend trusting the predicted P2BB over the current P2BB because it simply takes more data into account, but the final decision is of course up to you.
Model accuracy and certainty
The model achieves a high level of accuracy, with a Mean Absolute Percentage Error (MAPE) of slightly below 10%. This level of precision allows businesses to confidently rely on the model's predictions when making data-driven decisions.
To further ensure stability, the model employs a 'certainty' criterion based on three factors:
- A narrow prediction interval - the model is confident in its outcome
- Sufficient amount of subscriptions & revenue in the test
- At least 2 weeks from the test start have passed
To assure the quality of the prediction is of the highest standards possible, prediction is considered reliable only if at least two of these criteria are met without completely failing the third.
When a new A/B test begins, the model provides a year-ahead revenue per 1k (our main A/B test metric) prediction for each paywall. Predictions are displayed only when they meet the certainty criteria. If the data is insufficient, the model will indicate "insufficient data for prediction”.
Limitations and considerations
While our predictive model is a powerful tool, it's important to consider its limitations.
The model's performance depends on the quality and representativeness of the available data. Unusual cohort behaviour or new apps not included in the training set can affect prediction accuracy.
Nevertheless, predictions are updated daily to reflect the latest data and user behaviors. This ensures that the insights you receive are always based on the most current information.
🚧 Note: This tool is a supplement to, not a replacement for, your expert judgment and understanding of your app's unique dynamics. Use these predictions as a guide alongside other metrics and market knowledge to make informed decisions.
Updated 5 months ago