
Analytics overview
See metrics for all of your apps in a single place in Adapty
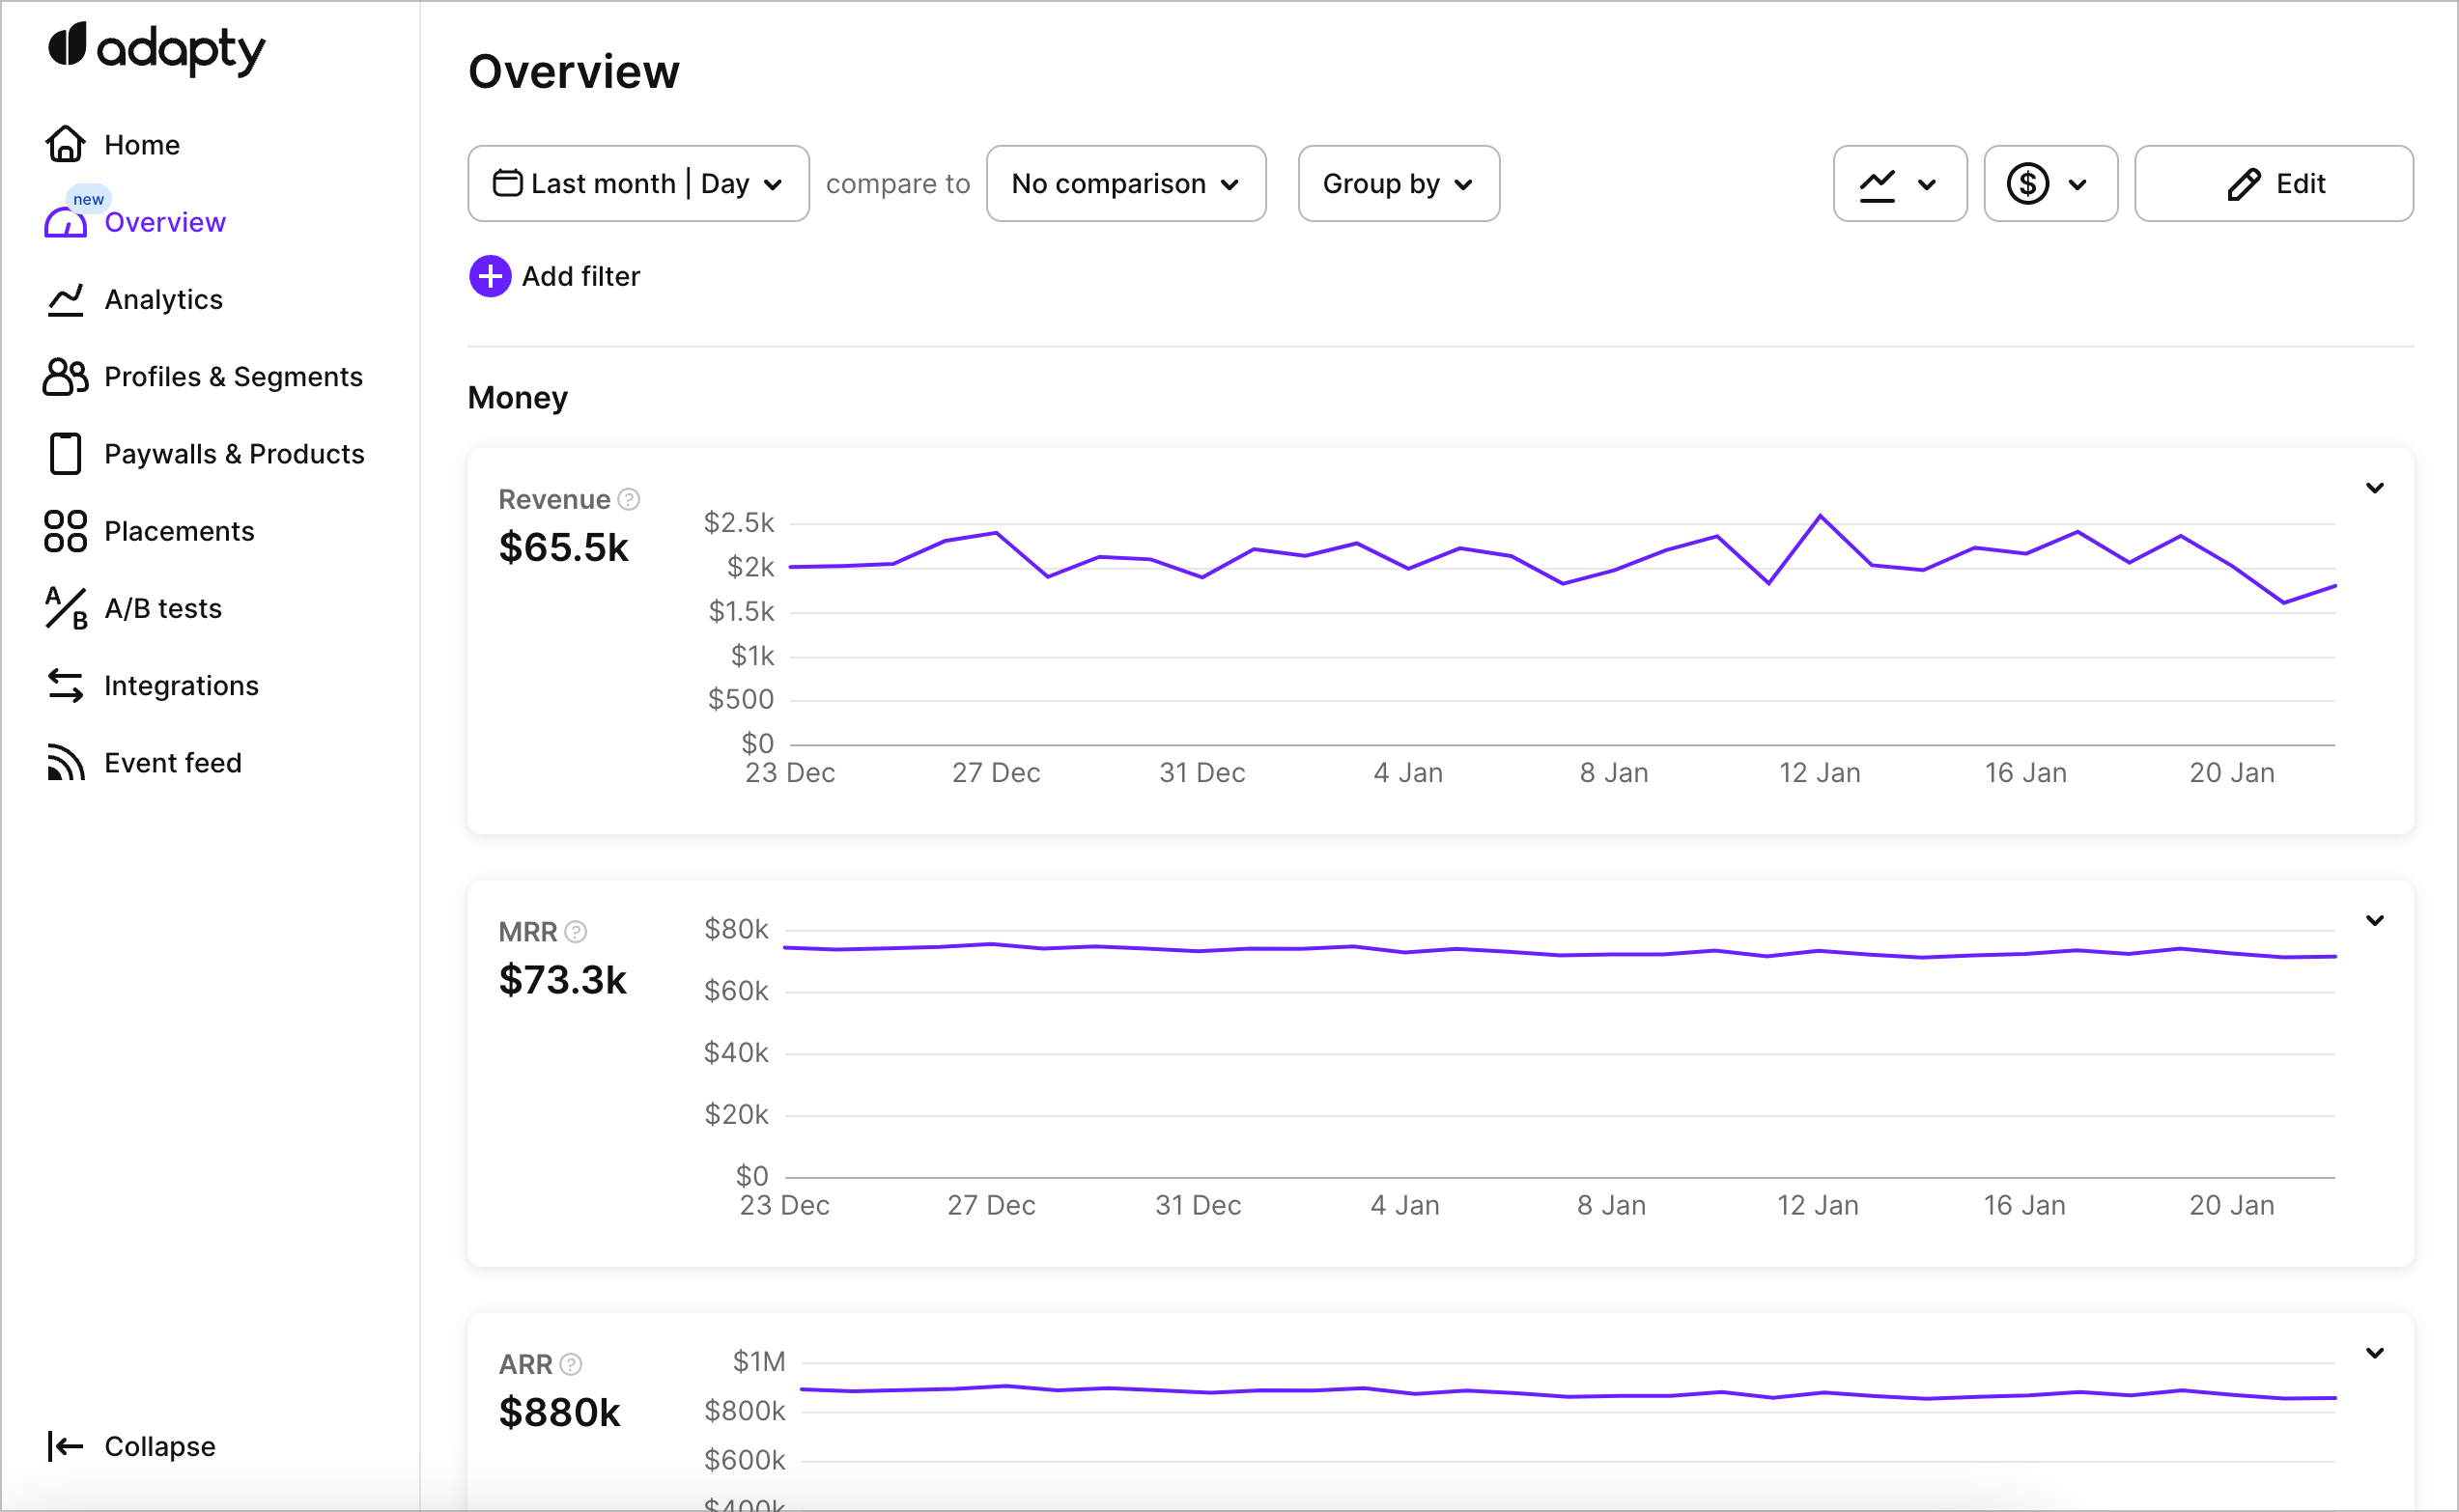
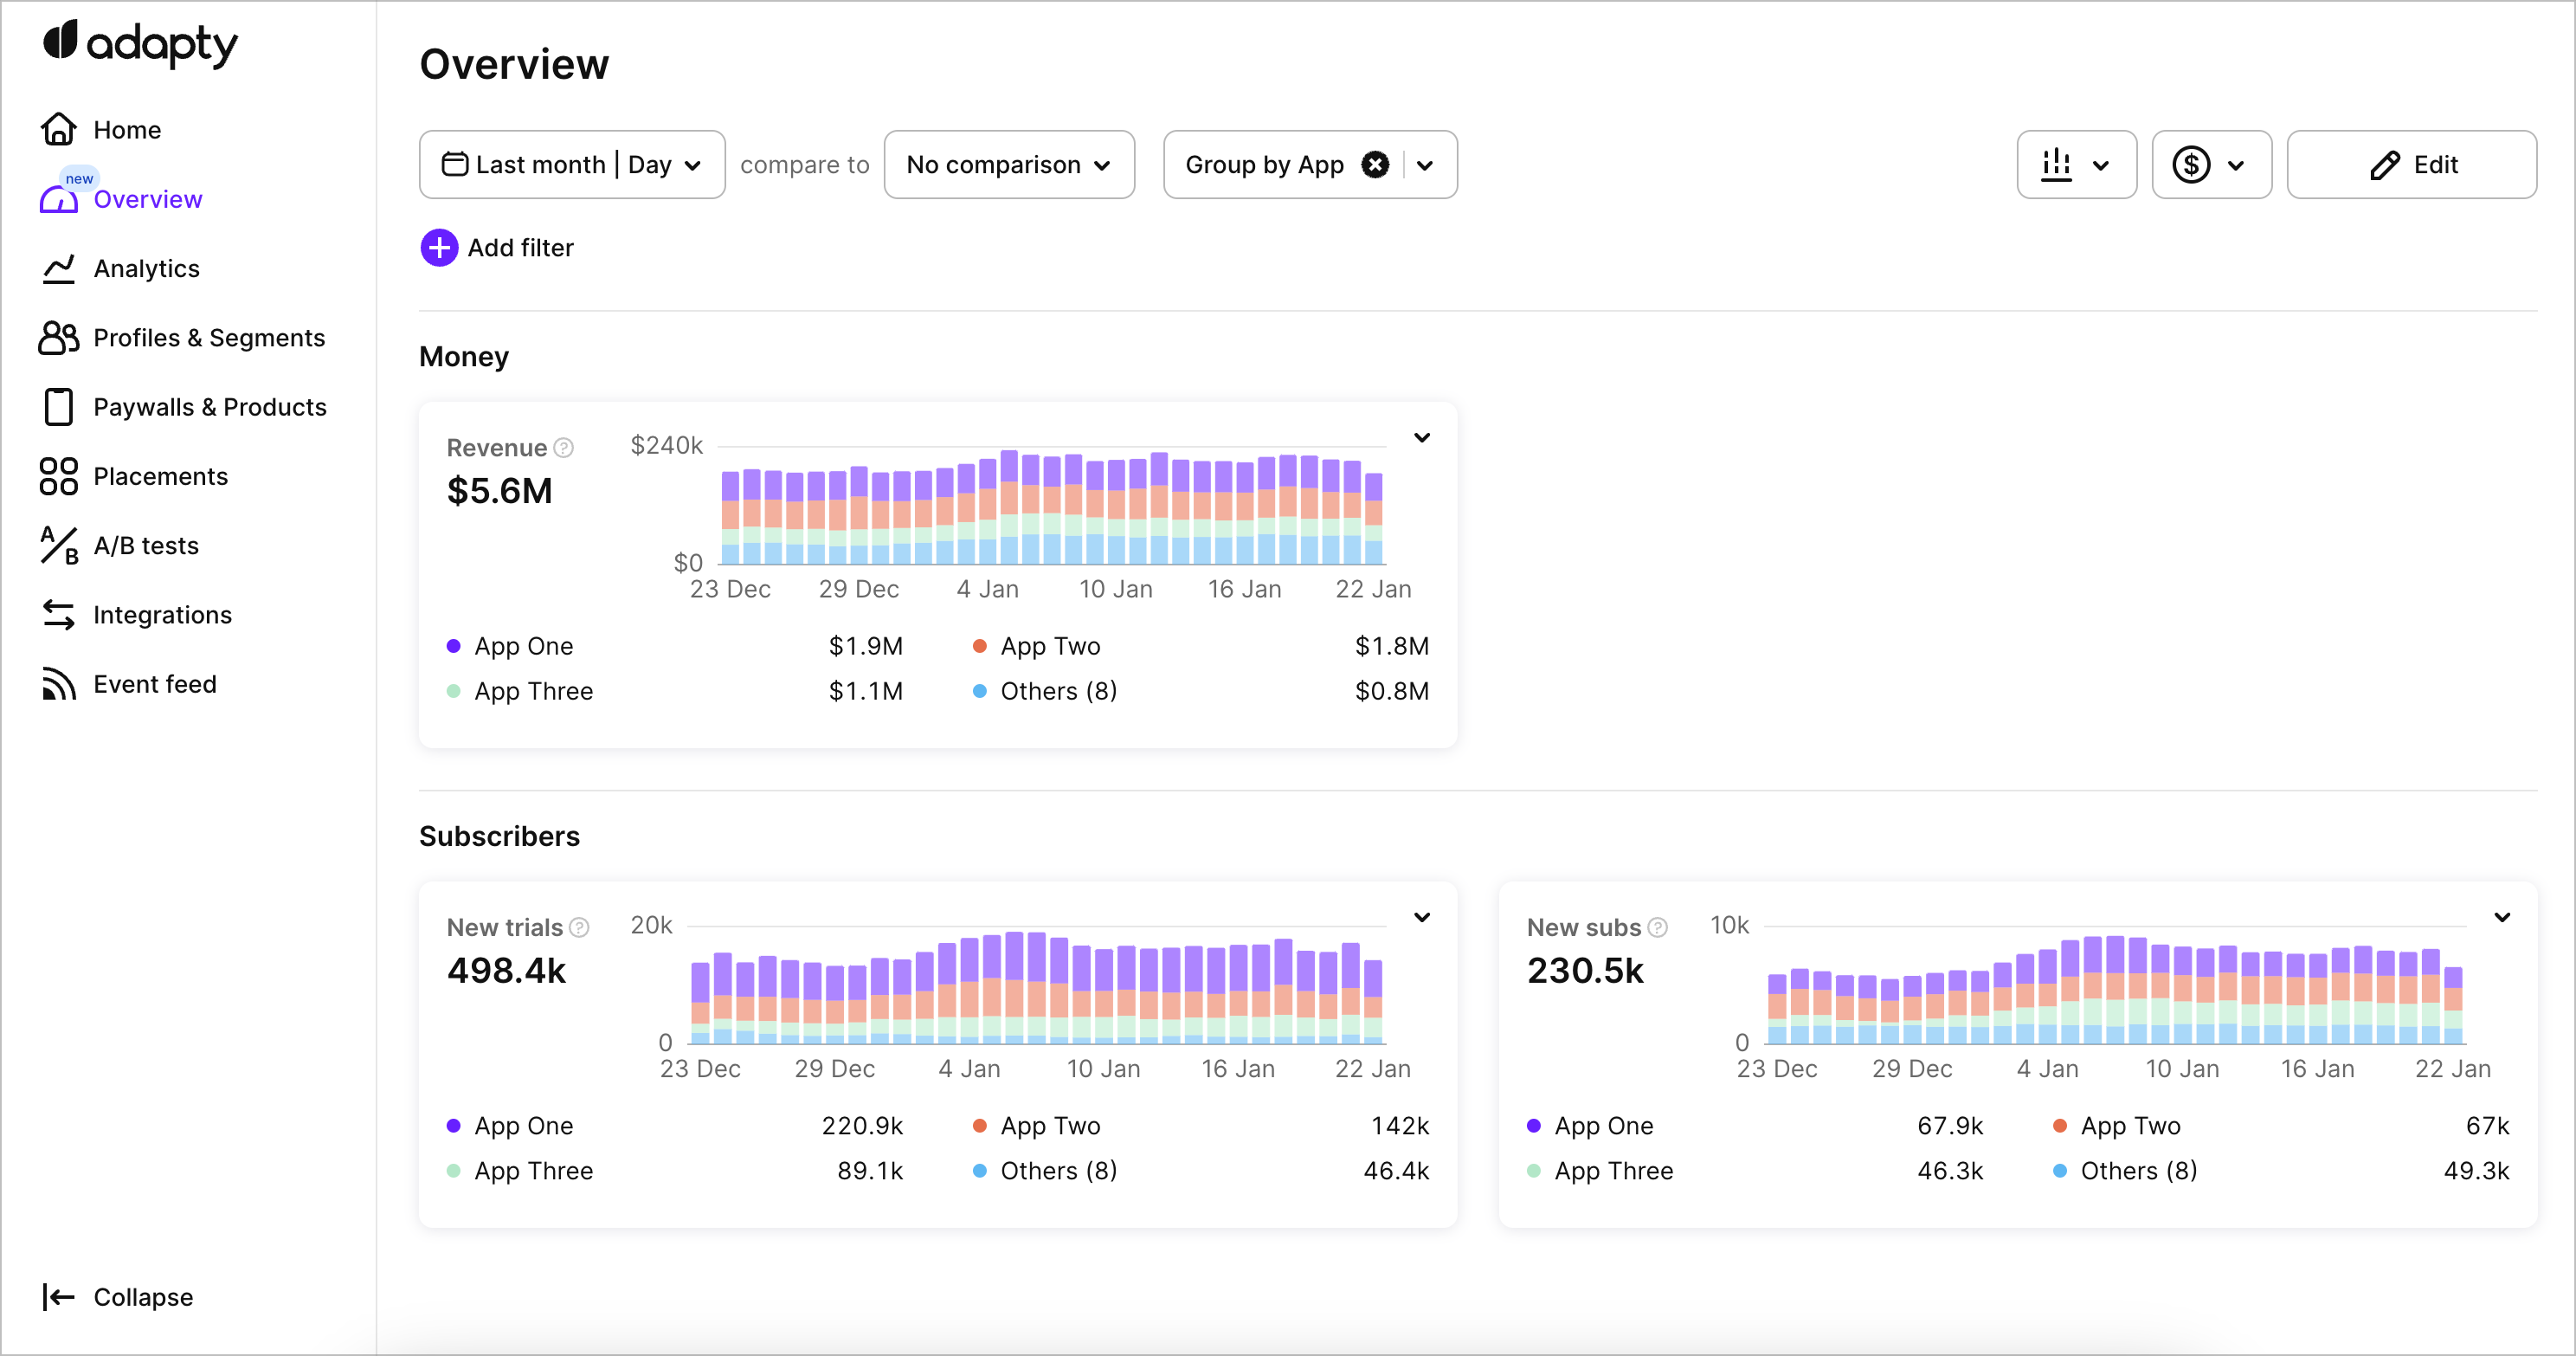
Overview is a section of Adapty Dashboard that allows you to see multiple metrics in a single place. You can customize which charts you would like to see and view data for all of your apps at once (unlike in Charts which you can use to dive deeper into a particular app).
It's located right under Home in the left-side menu:
Charts
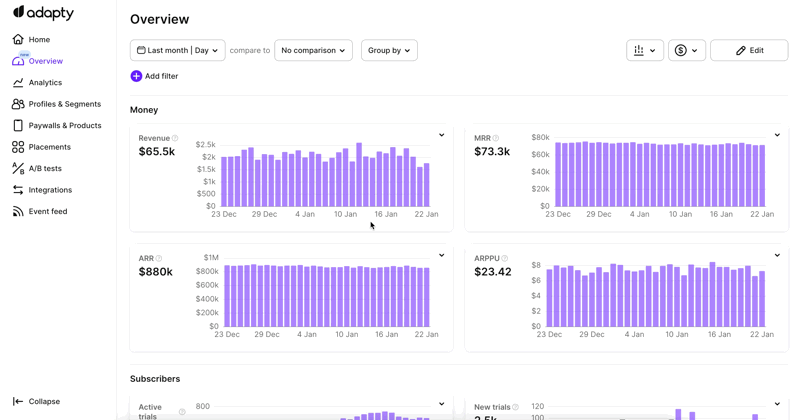
Overview has the following charts available (you can click on the name to learn more about how we calculate it):
- Revenue
- MRR
- ARR
- ARPPU
- New trials
- New subscriptions
- Active trials
- Active subscriptions
- New non-subscriptions
- Refund events
- Refund money
You can customize which charts to show as well as their order. To do that, press Edit in the top-right corner and then either remove charts you don't need, add more or rearrange existing ones by drag and dropping. You can also customize Overview contents in the "Add" menu:
Controls
Controls for diving deeper into your data in Overview are very similar to what we have in Charts — and most of them are described in Analytics controls.
There is one important difference though: you can group and filter by country, store and, most notably, by app — as Overview shows data for all of your apps at once by default. This can be helpful to understand how each of your app contributes to your business metrics:
Timezone control
By default, the timezone for Overview is inherited from one of your apps. But if your apps have different reporting timezones in their settings, you can customise the timezone for Overview by pressing Edit and selecting the appropriate one in the dropdown that will appear.
Updated 12 days ago