
Analytics charts
Out-of-the-box ready subscription analytics for most important metrics: MRR, revenue, trials, cancellations, purchases, ARPPU. All platforms: iOS, Android, Web
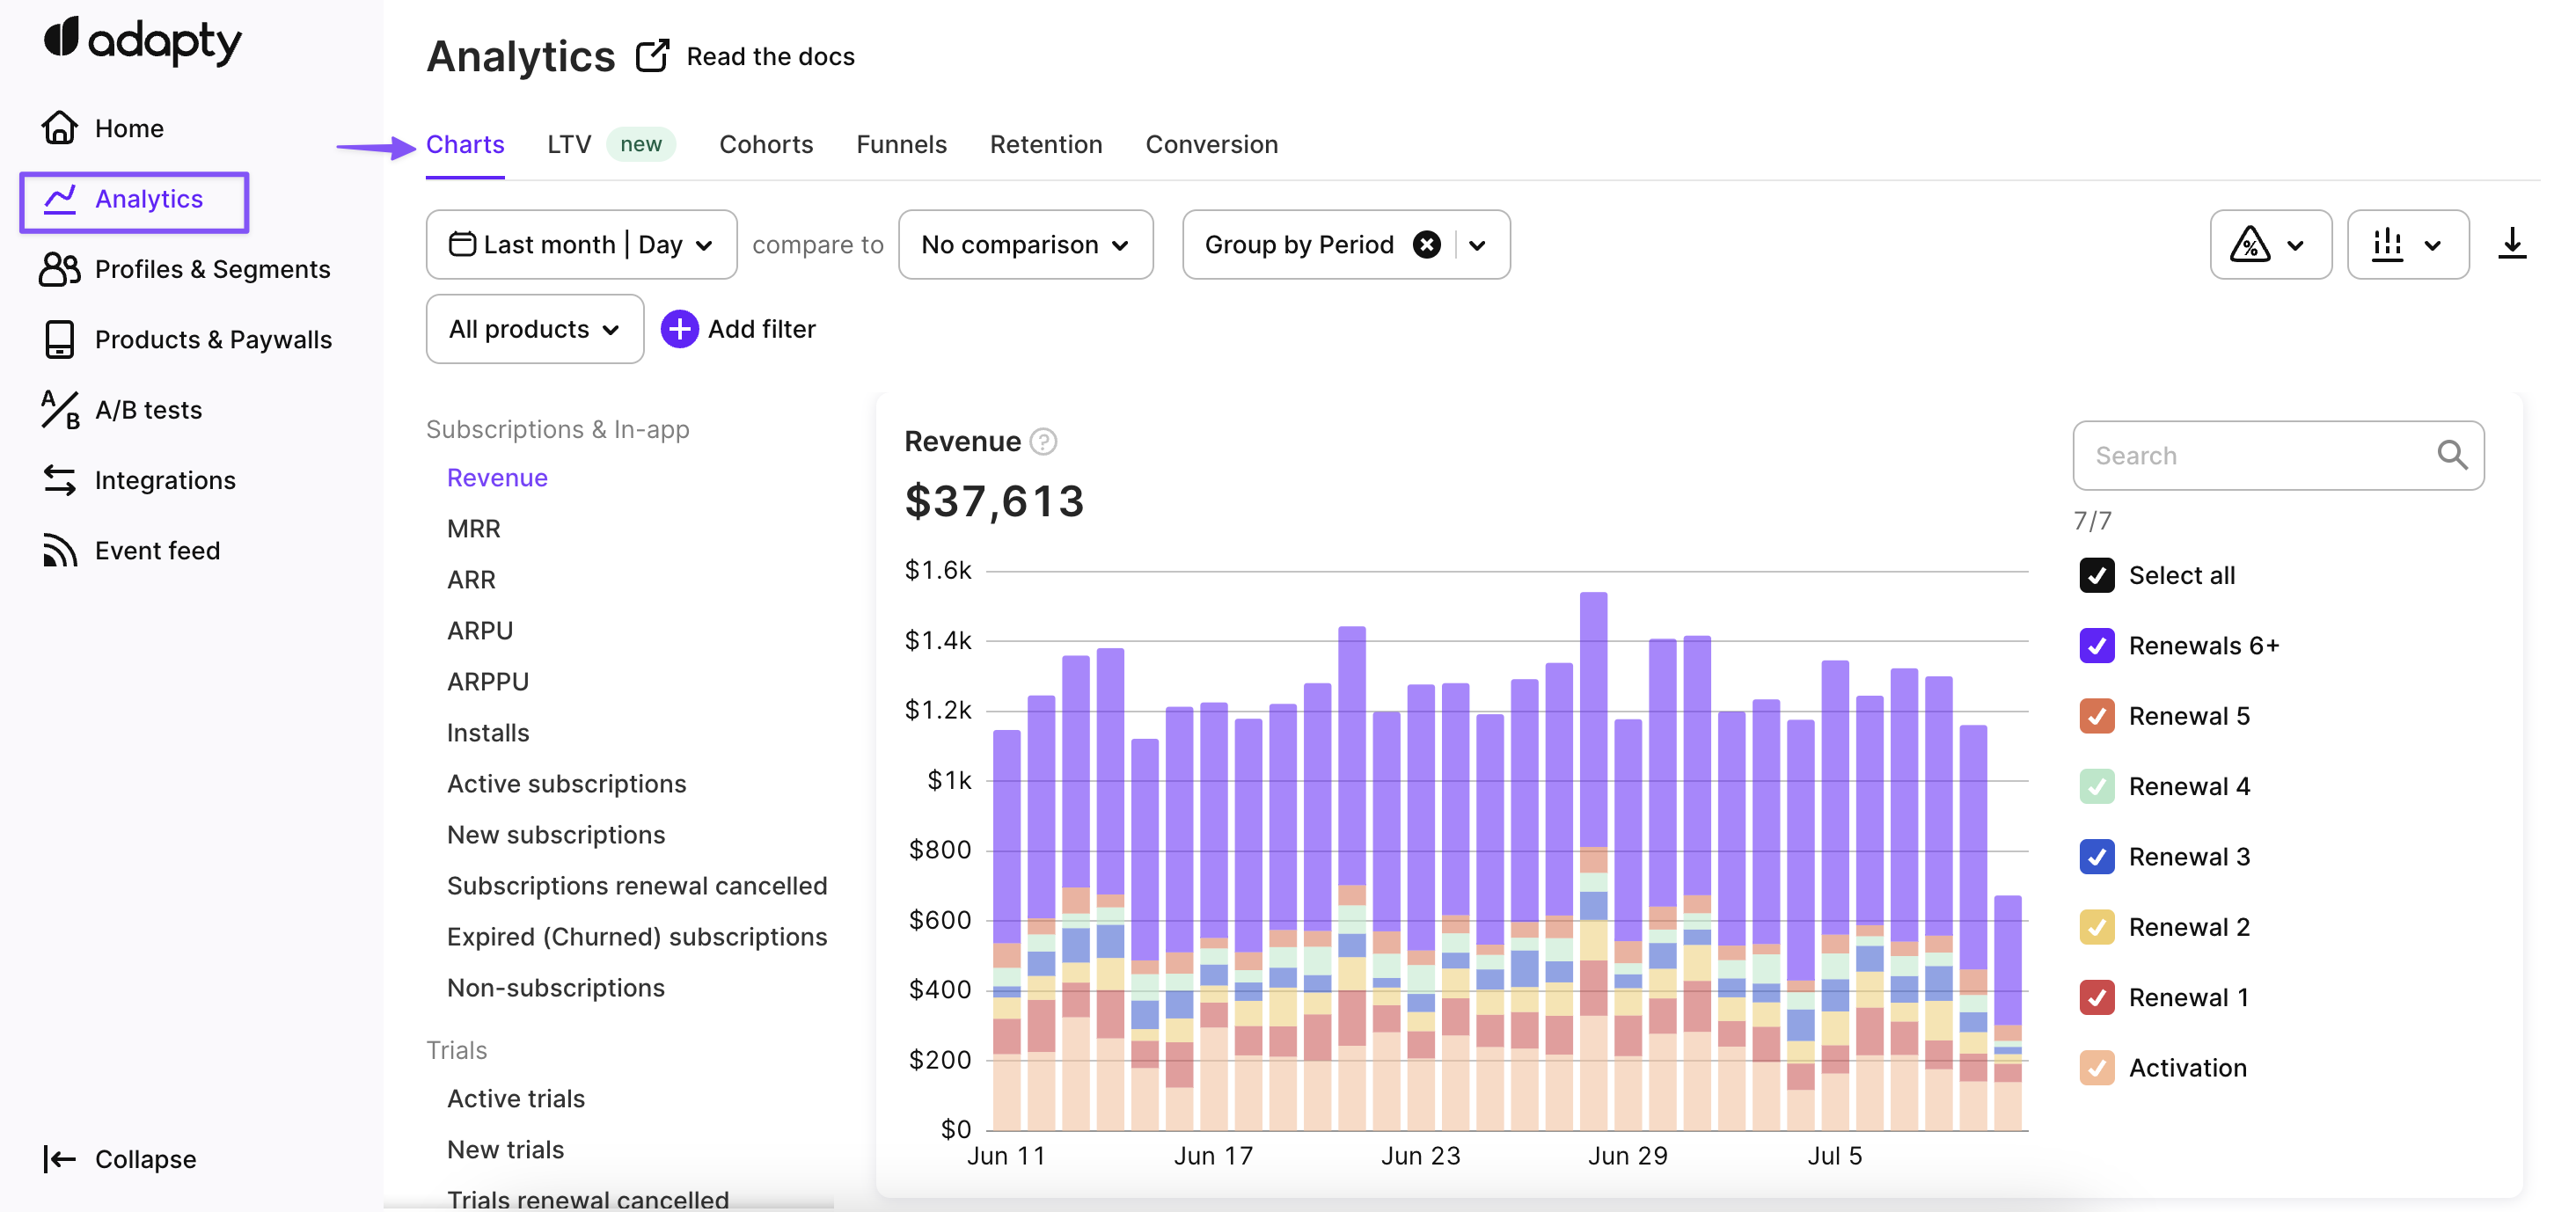
Adapty's charts provide a comprehensive view of your app's performance metrics, enabling you to quickly and easily track key data points like user engagement, retention, and revenue.
To access any of Adapty's charts, navigate to the Charts section in the Analytics dashboard.
Adapty Charts
Adapty charts are built using real-time data, so you can always stay up-to-date with the latest metrics. We also offer advanced controls that allow you to filter and group data by a range of criteria, including country, paywall, and product, giving you even greater flexibility and insight.
Adapty offers a wide range of charts to help you analyze and visualize your app's performance data. Here are the charts currently available in Adapty:
Subscription and in-app charts
- Revenue: Track your app's total revenue, broken down by date or other criteria.
- MRR (Monthly recurring revenue): See how your app's recurring revenue is performing month-over-month.
- ARR (Annual recurring revenue): Track your app's recurring revenue on an annual basis.
- ARPU (Average revenue per user): Measure how much revenue your app is generating per user.
- ARPPU (Average revenue per paying user): Measure how much revenue your app is generating per paying user.
- Installs: Monitor the number of app installs over a specific period.
- Active subscriptions: Keep track of the number of active subscriptions in your app.
- New subscriptions: Analyze the number of new subscriptions generated in a specific period.
- Subscription renewal cancelled: Track the number of subscriptions that were canceled before renewal.
- Expired (churned) subscriptions: See the number of expired subscriptions or users who have churned.
- Non-subscriptions: Analyze the revenue generated by non-subscription in-app purchases.
Trials charts
- Active trials: Monitor the number of active free trials in your app.
- New trials: Analyze the number of new trials generated in a specific period.
- Trial renewal cancelled: Track the number of trials that were canceled before renewal.
- Expired (churned) trials: See the number of expired trials.
Issues charts
- Grace period: Analyze how long users are in the grace period after a failed payment.
- Billing issues: Track the number of failed payments, chargebacks, and other billing issues.
- Refund events: Monitor the number of refunds processed by your app.
- Refund money: Analyze the amount of revenue lost due to refunds.
Each of these charts provides a unique perspective on your app's performance, helping you identify trends, track progress, and make data-driven decisions.
Adapty's charts are designed to be highly customizable, giving you complete control over how you view and analyze your app's performance data. To get the most out of our charts, check our Analytics controls documentation, which provides a detailed overview of all the features and functionality available.
Updated 12 days ago