
Non-subscriptions
The Non-subscriptions chart displays the number of in-app purchases such as consumables, non-consumables, and non-renewing subscriptions. The chart doesn't include renewable payments. The chart shows the total count of these types of in-app purchases and can help you track user behavior and engagement over time.
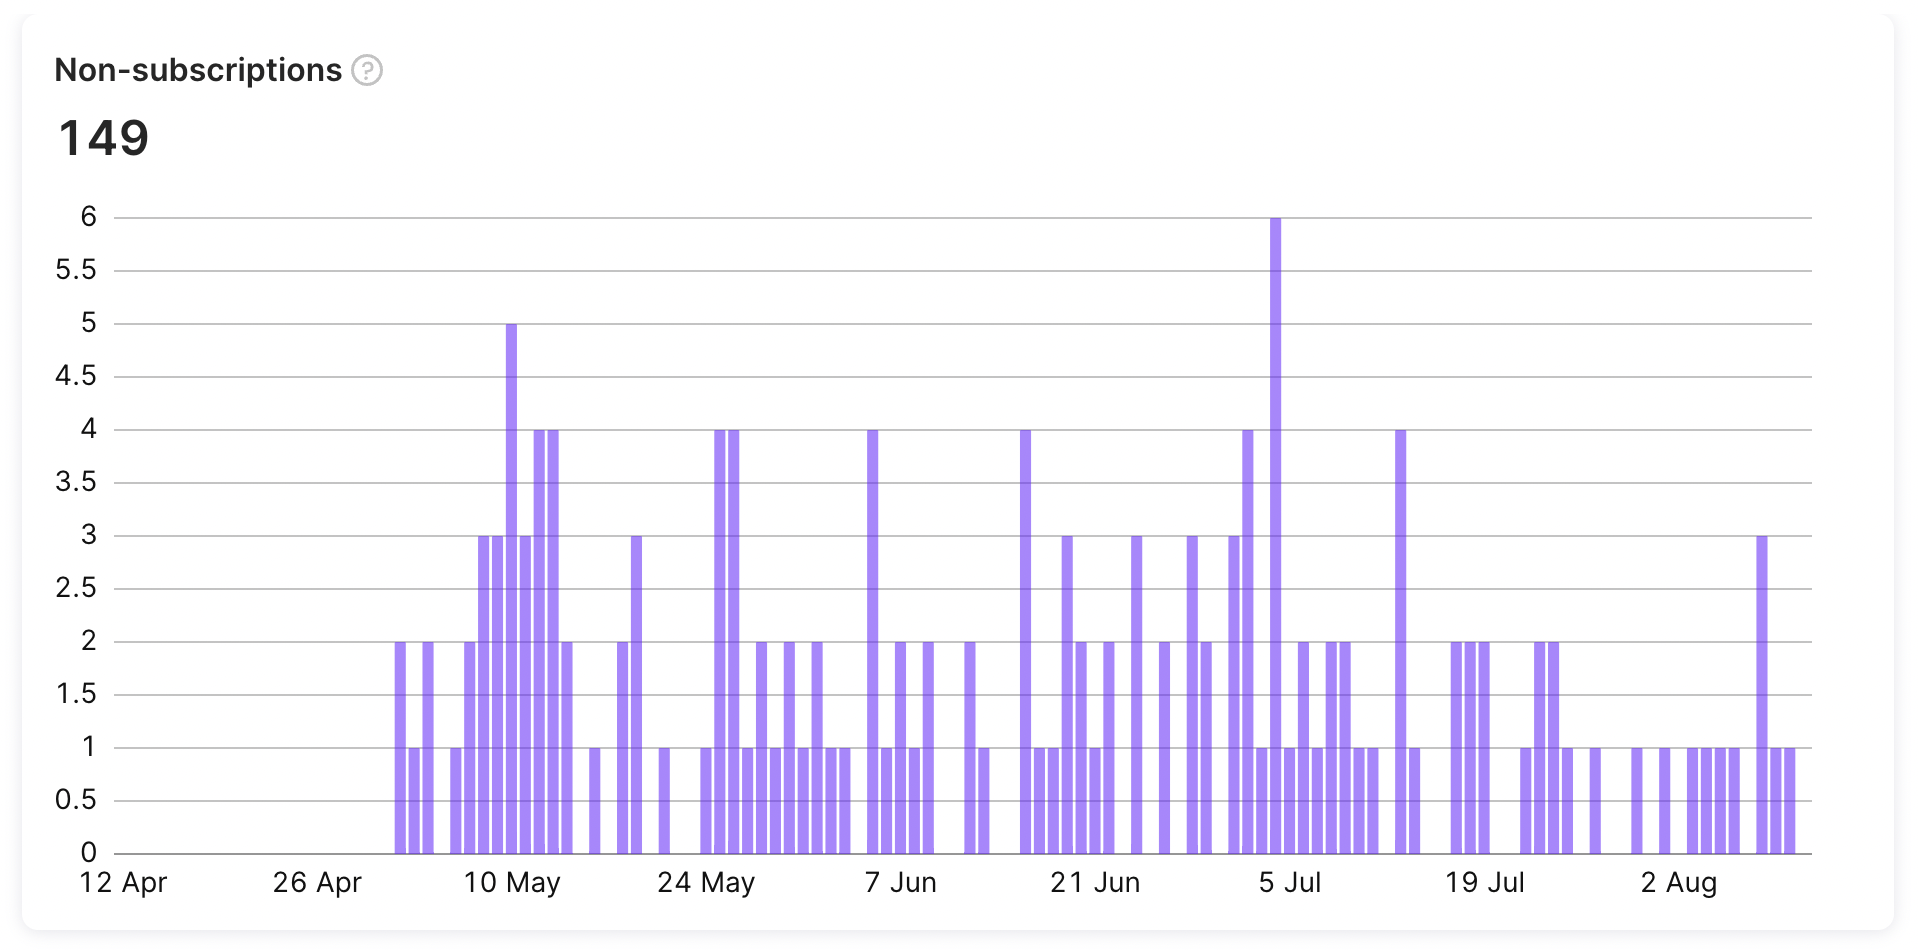
Non-subscriptions chart
Calculation
Adapty's calculation logic for the Non-subscriptions chart involves counting the number of in-app purchases made by users that are classified as consumables, non-consumables, and non-renewing subscriptions. This chart excludes renewable payments such as auto-renewing subscriptions.
- Consumables are items that users can purchase multiple times, such as fish food in a fishing app, or extra in-game currency.
- Non-consumables are items that users can purchase once and use forever, such as a race track in a game app, or ad-free versions of an app.
- Non-renewing subscriptions are subscriptions that expire after a set period of time and do not renew automatically, such as a one-year subscription to a catalog of archived articles. The content of this in-app purchase can be static, but the subscription will not renew automatically once it expires.
Available filters and grouping
- ✅ Filter by: Attribution, country, paywall, and store.
- ✅ Group by: Product, country, store, paywall, attribution status, attribution channel, attribution campaign, attribution ad group, attribution ad set, and attribution creative.
You can find more information about the available controls, filters, grouping options, and how to use them in this documentation.
Non-subscriptions chart usage
The Non-subscriptions chart is an important tool for app developers to gain insights into the types of in-app purchases made by users, including consumables, non-consumables, and non-renewing subscriptions. By tracking this metric over time, you can better understand user behavior and engagement with their app. Using the Non-subscriptions chart with filters and grouping, you can dive deeper into their users' purchase patterns and preferences, helping them to optimize pricing strategies and improve overall user satisfaction. The Non-subscriptions chart is an essential tool for app to make data-driven decisions that ultimately lead to a better user experience and increased revenue.
Similar metrics
In addition to non-subscriptions, Adapty also provides metrics for other subscription-related events, such as active subscriptions, new subscriptions, subscriptions renewal canceled, and expired subscriptions. To learn more about these subscriptions-related metrics, please refer to the following documentation guides:
Updated 12 days ago