
Paywall metrics
Adapty collects a series of metrics to help you better measure the performance of the paywalls. All metrics are updated in real-time, except for the views, which are updated once every several minutes. All metrics, except for the views, are attributed to the product within the paywall. This document outlines the metrics available, their definitions, and how they are calculated.
Paywall metrics are available on the paywall list, providing you with an overview of the performance of all your paywalls. This consolidated view presents aggregated metrics for each paywall, allowing you to assess their effectiveness and identify areas for improvement.
For a more granular analysis of each paywall, you can navigate to the paywall detail metrics. In this section, you will find comprehensive metrics specific to the selected paywall, offering deeper insights into its performance.
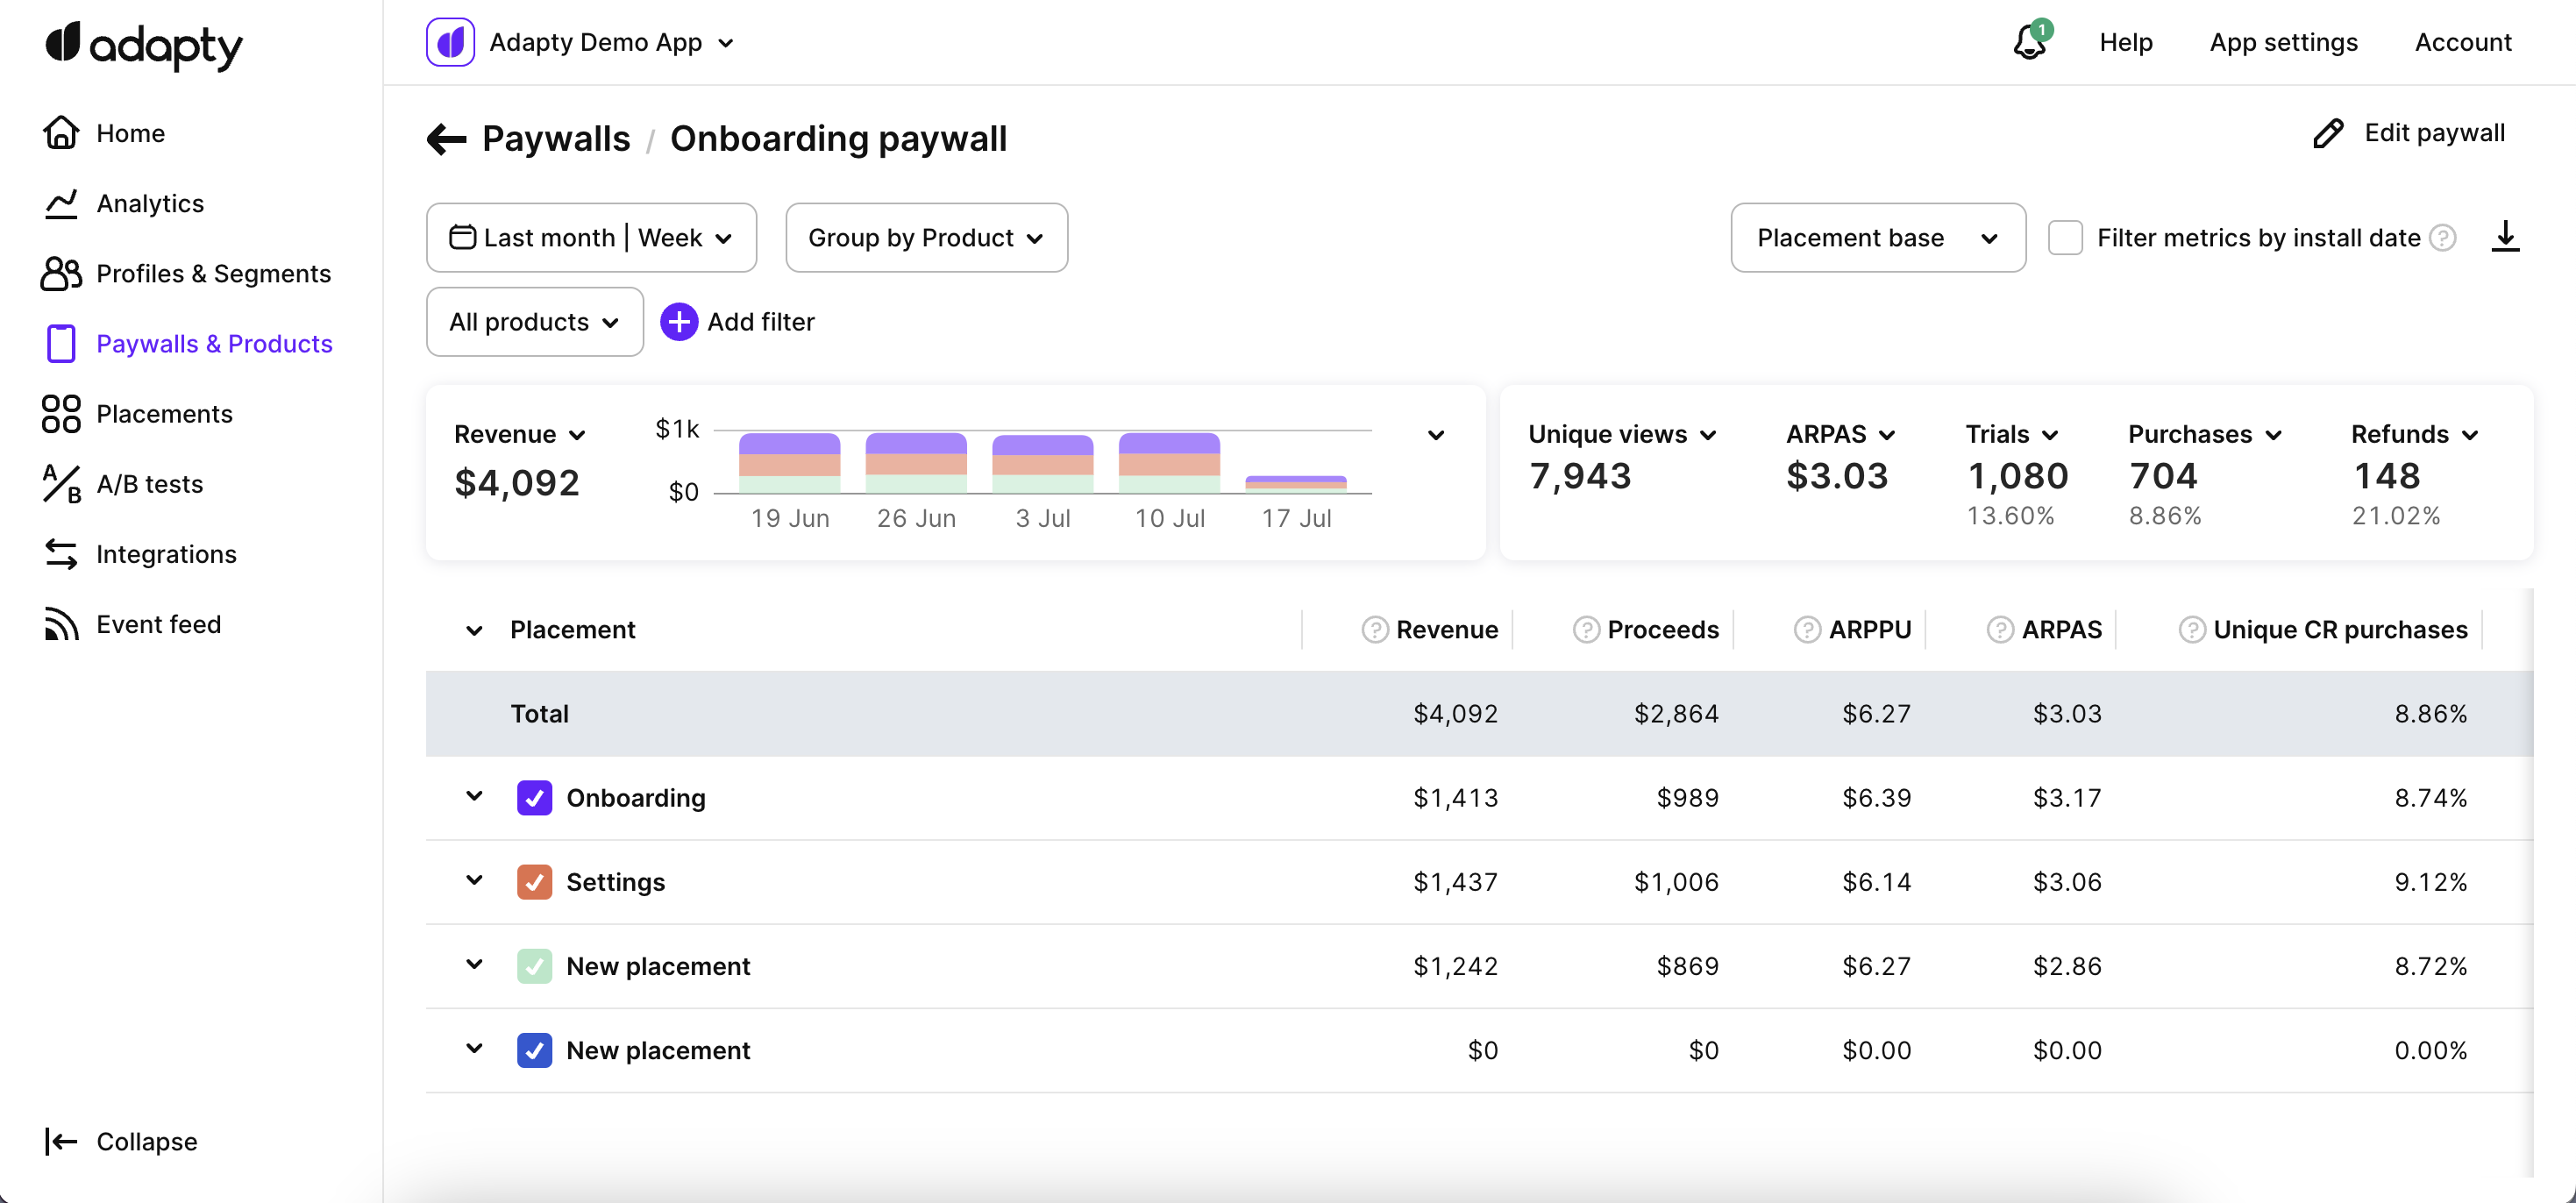
Paywall metrics page
Metrics controls
The system displays the metrics based on the selected time period and organizes them according to the left-side column parameter with three levels of indentation.
For Live paywall, the metrics cover the period from the paywall's start date until the current date. For inactive paywalls, the metrics encompass the entire period from the start date to the end of the selected time period. Draft and archived paywalls are included in the metrics table, but if there is no data available for those paywalls, they will be listed without any displayed metrics.
View options for metrics data
View options for paywall metrics
The paywall page offers two view options for metrics data: placement-based and audience-based.
In the placement-based view, metrics are grouped by placements associated with the paywall. This allows users to analyze metrics by different placements.
In the audience-based view, metrics are grouped by the target audience of the paywall. Users can assess metrics specific to different audience segments. You can select the preferred view using the dropdown option at the top of the paywall detail page.
Profile install date filtration

Profile install date filtration control for paywall metrics
The Filter metrics by install date checkbox enables the filtering of metrics based on the profile install date, instead of the default filters that use trial/purchase date for transactions or view date for paywall views. By selecting this checkbox, you can focus on measuring user acquisition performance for a specific period by aligning metrics with the profile install date. This option is useful for customizing the metrics analysis according to your specific needs.
Time ranges
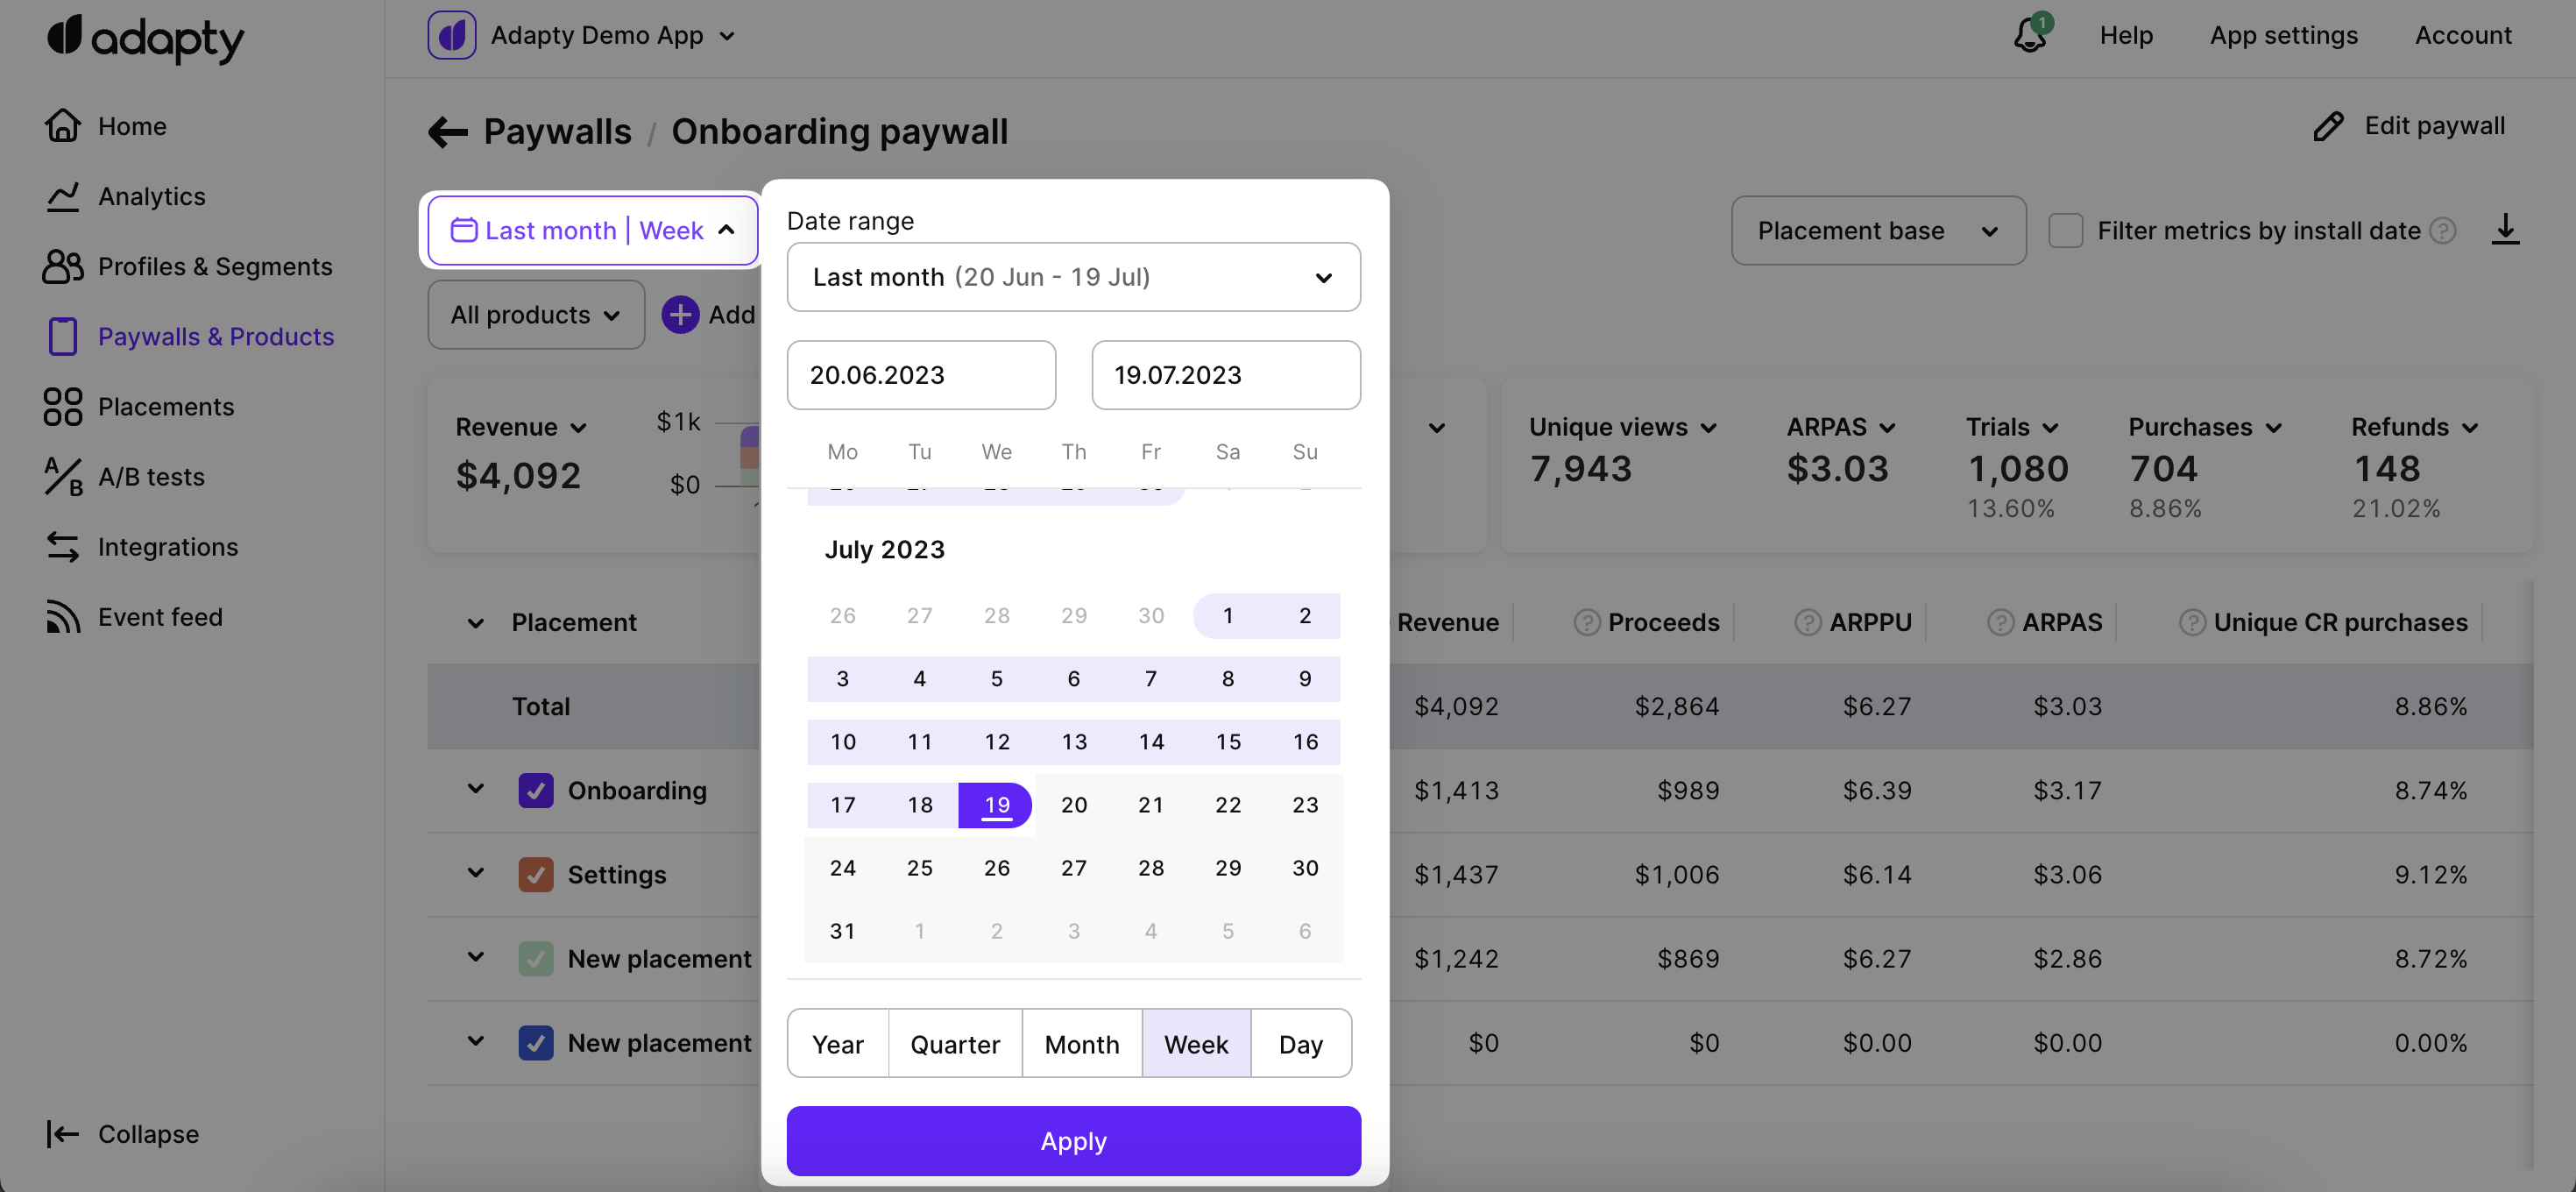
Time range filtration for paywall metrics
You can choose from a range of time periods to analyze metrics data, allowing you to focus on specific durations such as days, weeks, months, or custom date ranges.
Available filters and grouping
Adapty offers powerful tools for filtering and customizing metrics analysis to suit your needs. With Adapty's metrics page, you have access to various time ranges, grouping options, and filtering possibilities.
- ✅ Filter by: Audience, country, paywall, paywall state, paywall group, placement, country, store, product, and product store.
- ✅ Group by: Product and store.
You can find more information about the available controls, filters, grouping options, and how to use them for paywall analytics in this documentation.
Single metrics chart
One of the key components of the paywall metrics page is the chart section, which visually represents the selected metrics and facilitates easy analysis.
The chart section on the paywall metrics page includes a horizontal bar chart that visually represents the chosen metric values. Each bar in the chart corresponds to a metric value and is proportional in size, making it easy to understand the data at a glance. The horizontal line indicates the timeframe being analyzed, and the vertical column displays the numeric values of the metrics. The total value of all the metric values is displayed next to the chart.
Metrics chart in the paywall metrics page
Additionally, clicking on the arrow icon in the top right corner of the chart section expands the view, displaying the selected metrics on the full line of the chart.
Total metrics summary
Next to the single metrics chart, the total metrics summary section is shown, which displays the cumulative values for the selected metrics at a specific point in time, with the ability for you to change the displayed metric using a dropdown menu.
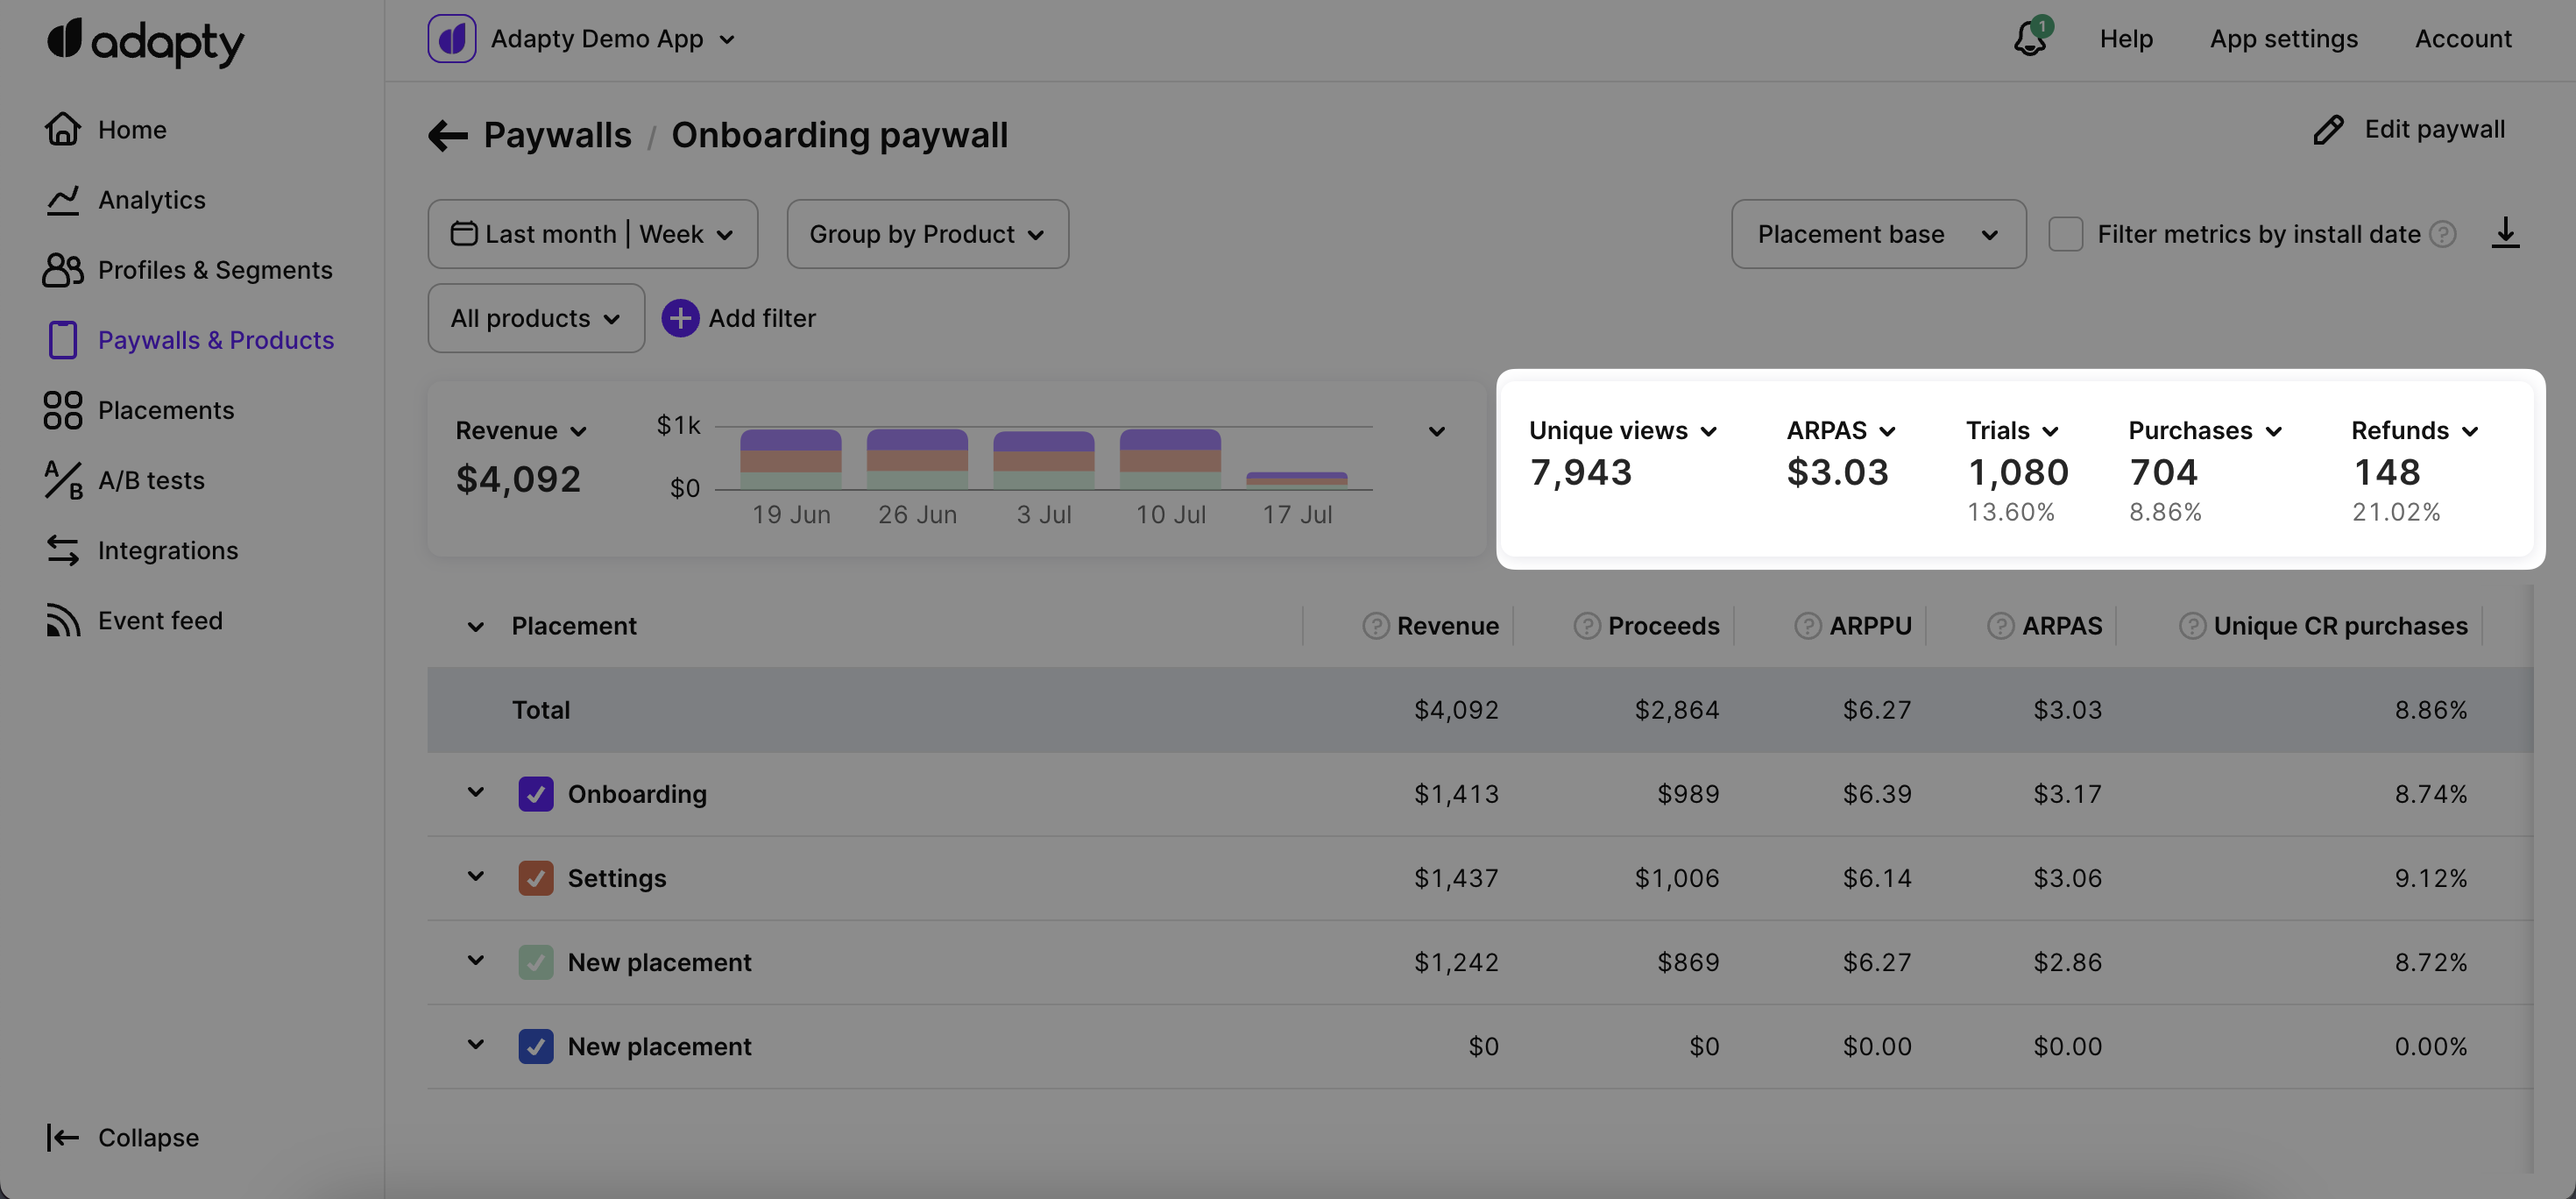
Total values of metrics in the paywall metrics page
Metrics definitions
Paywall metrics in Adapty
Revenue
This metric represents the total amount of money generated in USD from purchases and renewals. Please note that the revenue calculation does not include the App Store / Play Store commission and is calculated before deducting any fees.
Proceeds
This metric represents the actual amount of money received by the app owner in USD from purchases and renewals after deducting the applicable App Store / Play Store commission. It reflects the net revenue that directly contributes to the app's earnings. For more information on how proceeds are calculated, you can refer to the Adapty documentation.
ARPPU
ARPPU is an average revenue per paying user. It’s calculated as total revenue divided by the number of unique paying users. $15000 revenue / 1000 paying users = $15 ARPPU.
ARPAS
The average revenue per active subscriber allows you to measure the average revenue generated per active subscriber. It is calculated by dividing the total revenue by the number of subscribers who have activated a trial or subscription. For example, if the total revenue is $5,000 and there are 1,000 subscribers, the ARPAS would be $5. This metric helps assess the average monetization potential per subscriber.
Unique conversion rate (CR) to purchases
The unique conversion rate to purchases is calculated by dividing the number of purchases by the number of unique views. For example, if there are 10 purchases and 100 unique views, the unique conversion rate to purchases would be 10%. This metric focuses on the ratio of purchases to the unique number of views, providing insights into the effectiveness of converting unique visitors into paying customers.
CR to purchases
The conversion rate to purchases is calculated by dividing the number of purchases by the total number of views. For example, if there are 10 purchases and 100 views, the conversion rate to purchases would be 10%. This metric indicates the percentage of views that result in purchases, providing insights into the effectiveness of your paywall in converting users into paying customers.
Unique CR to trials
The unique conversion rate to trials is calculated by dividing the number of trials started by the number of unique views. For example, if there are 30 trials started and 100 unique views, the unique conversion rate to trials would be 30%. This metric measures the percentage of unique views that result in trial activations, providing insights into the effectiveness of your paywall in converting unique visitors into trial users.
Purchases
Purchases represent the cumulative total of various transactions made on the paywall. The following transactions are included in this metric (renewals are not included):
- New purchases, that are made directly on the paywall.
- Trial conversions of trials that were initially activated on the paywall.
- Downgrades, upgrades, and cross-grades of subscriptions made on the paywall.
- Subscription restores on the paywall, such as when a subscription is reinstated after expiration without auto-renewal.
By considering these different types of transactions, the purchases metric provides a comprehensive view of the overall acquisition and monetization activity on your paywall.
Trials
The trials metric represents the total number of trials that have been activated. It reflects the number of users who have initiated trial periods through your paywall. This metric helps track the effectiveness of your trial offering and can provide insights into user engagement and conversion from trials to paid subscriptions.
Trials canceled
The trials canceled metric represents the number of trials in which the auto-renewal feature has been switched off. This occurs when users manually unsubscribe from the trial, indicating their decision not to continue with the subscription after the trial period ends. Tracking trials canceled provides valuable information about user behavior and allows you to understand the rate at which users opt out of the trial.
Refunds
The refunds metric represents the number of refunded purchases and subscriptions. This includes transactions that have been reversed or refunded due to various reasons, such as customer requests, payment issues, or any other applicable refund policies.
Refund rate
The refund rate is calculated by dividing the number of refunds by the number of first-time purchases (renewals are not included). For example, if there are 5 refunds and 1000 first-time purchases, the refund rate would be 0.5%.
Views
The views metric represents the total number of times the paywall has been viewed by users. Each time a user visits the paywall, it is counted as a separate view. For example, if a user visits the paywall two times, it will be recorded as two views. Tracking views helps you understand the level of engagement and user interaction with your paywall, providing insights into user behavior and the effectiveness of your paywall placement and design.
Unique views
The unique views metric represents the number of unique instances in which the paywall has been viewed by users. Unlike total views, which count each visit as a separate view, unique views count each user's visit to the paywall only once, regardless of how many times they access it. For example, if a user visits the paywall two times, it will be recorded as one unique view. Tracking unique views helps provide a more accurate measure of user engagement and the reach of your paywall, as it focuses on individual users rather than the total number of visits.
Make sure to send paywall views to Adapty using
.logShowPaywall()method. Otherwise, paywall views will not be accounted for in the metrics and conversions will be irrelevant.
Updated 4 months ago