
New trials
The new trial chart displays the number of activated trials during the selected time period.
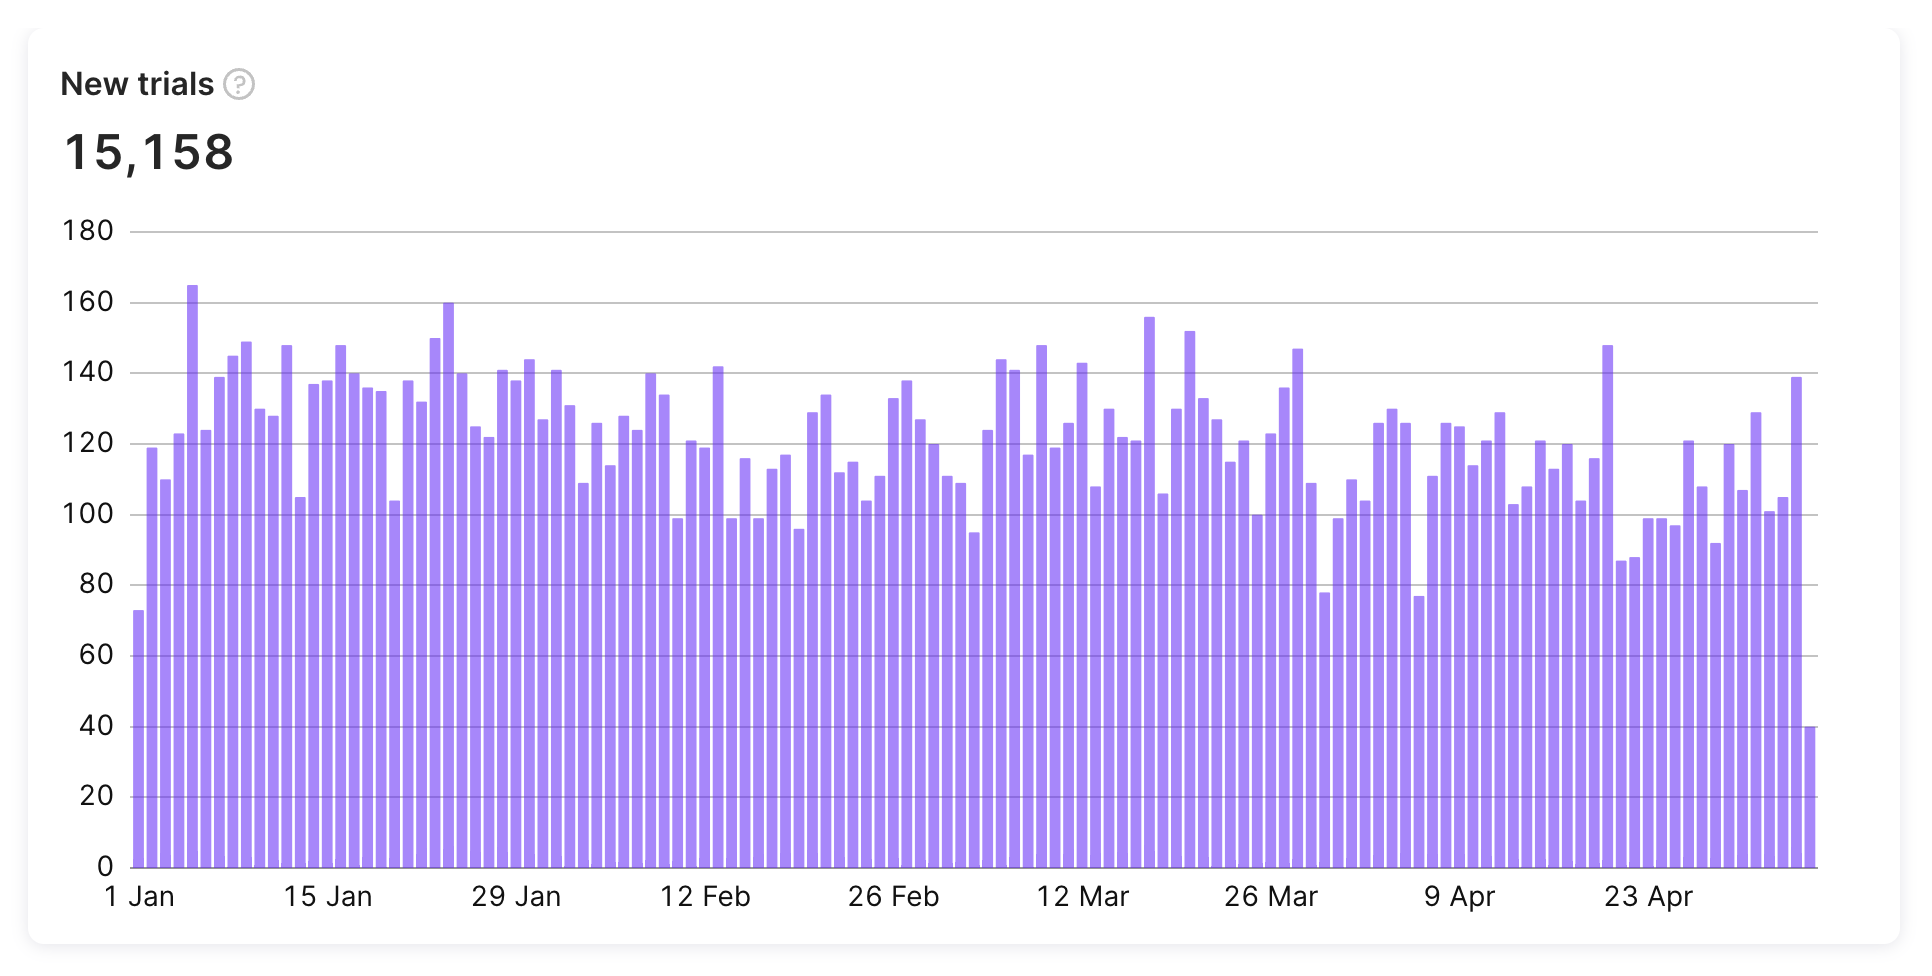
New trials chart
Calculation
Adapty's calculation of the new trials refers to the number of trials initiated during a specific period. Adapty tracks the number of trials started within the selected period, regardless of their status (expired or active) at the end of the period.
For example, if you select a monthly period and 50 users start a trial during that month, then the number of new trials initiated during that period would be 50. Similarly, if you choose a daily resolution, Adapty tracks the number of trials started each day, regardless of their status at the end of the day.
Available filters and grouping
- ✅ Filter by: Attribution, country, paywall, store, product, and duration.
- ✅ Group by: Product, country, store, paywall, duration, attribution status, attribution channel, attribution campaign, attribution ad group, attribution ad set, and attribution creative.
You can find more information about the available controls, filters, grouping options, and how to use them in this documentation.
New trials chart usage
The New trials chart is a powerful tool for tracking the effectiveness of your app's promotional campaigns and user acquisition efforts. For instance, if you run a targeted ad campaign on social media or search engines, you can use the New trials chart to monitor the number of new trials initiated during the campaign period. By analyzing this data, you can determine the effectiveness of the campaign and make data-driven decisions to optimize your promotional strategies in the future.
Similar metrics
In addition to New Trials, Adapty also provides metrics for other trial-related events, such as Active trials, Trial renewal cancelled, and Expired trials. To learn more about these trial-related metrics, please refer to the following documentation:
Updated 12 days ago