
ARR
Annual recurring revenue
The Annual recurring revenue chart shows revenue from all active auto-renewable subscriptions normalized to one year. The chart considers any paid, unexpired subscription as active. ARR is a crucial metric for tracking your subscription business's growth and predicting future revenue.
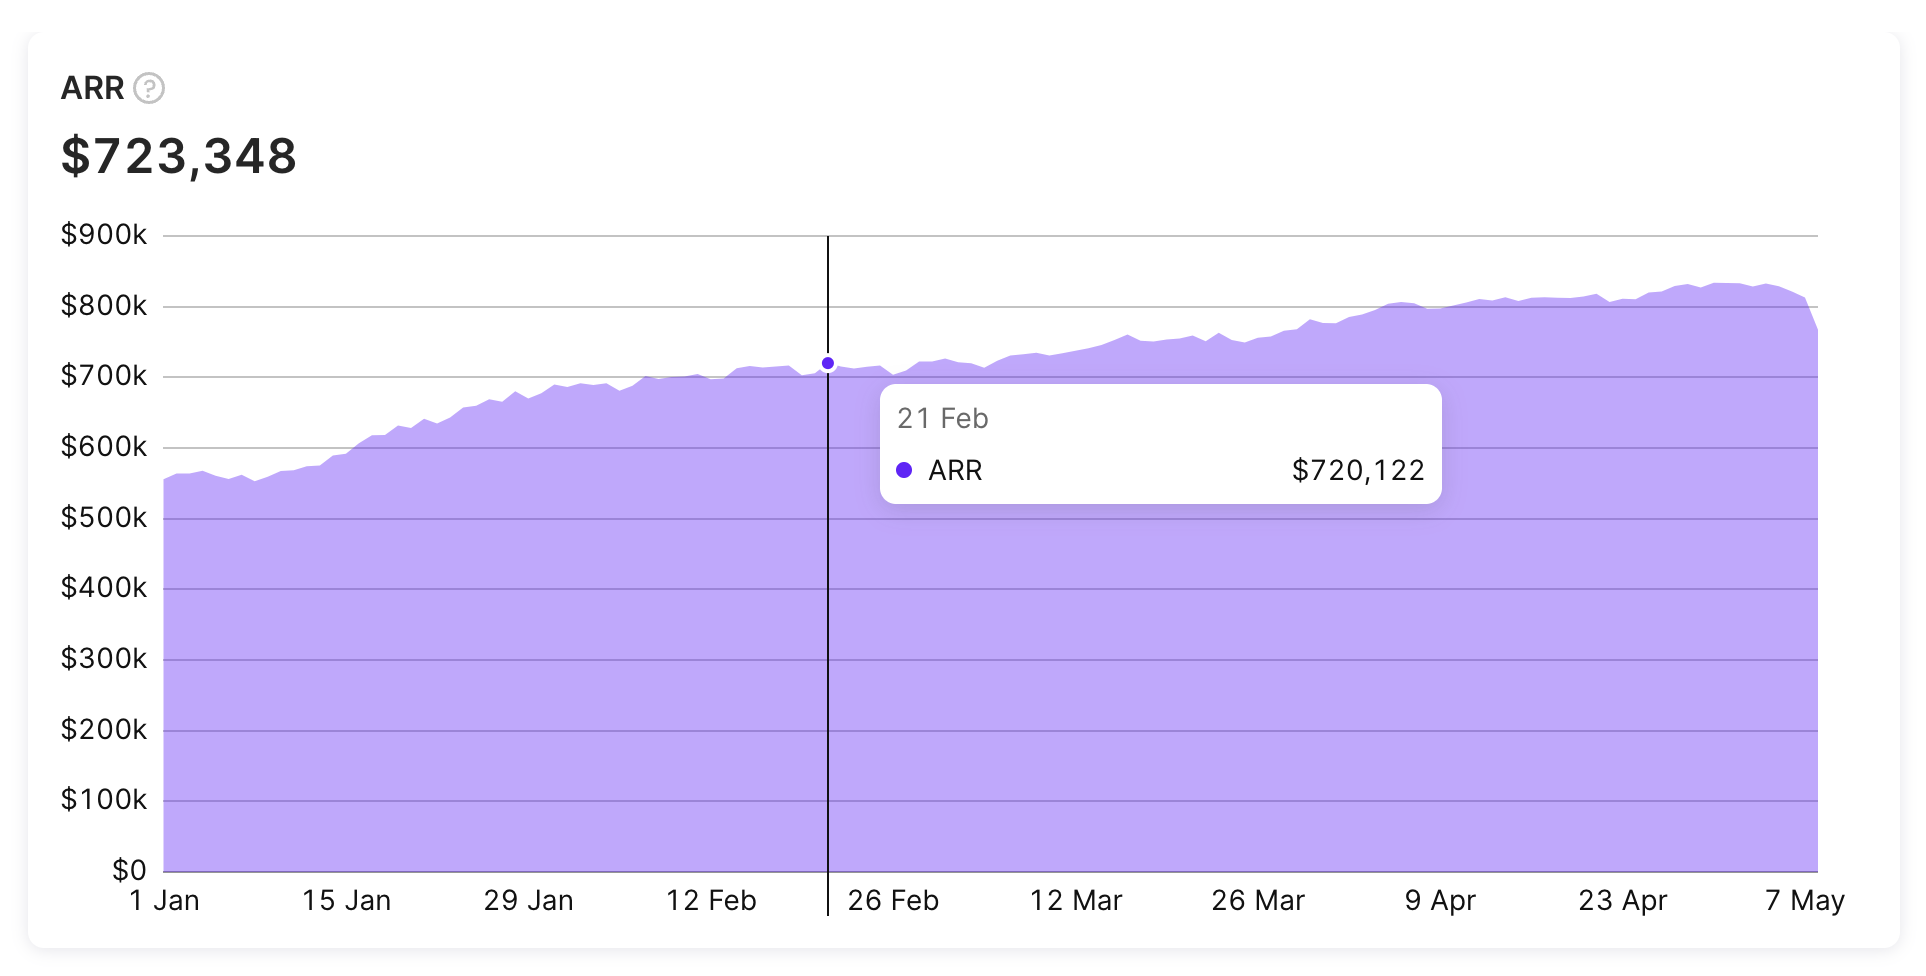
Annual Recurring Revenue chart
Calculation
The Adapty ARR chart calculates the total revenue generated by the app. Any paid, unexpired subscription is considered active. ARR includes normalized annual revenue from all active paid subscriptions – even if their auto-renew status is currently disabled. This also means non-recurring subscriptions, consumable, or one-time purchases included in ARR calculation. The metric is calculated before the store's fee.
ARR = sum of ( (Ps * Ns / Dsy)
where Ps - subscription price,
Ns - number of active paid subscriptions for this subscription,
Dsy - subscription duration in years (1/12 for monthly and ~1/52 for weekly subscriptions).
This metric is only useful when annual subscriptions are the biggest chunk of your sales.
For example, there are 2 active annual subscriptions with a price of $240, and 10 monthly subscriptions with a price of $30, and 20 weekly subscriptions with a price of $10,
ARR = (2 $240 / 1) + (10 $30 / (1/12)) + (20*$10 / (1/52)) = $14480
Available filters and grouping
- ✅ Filter by: Attribution, country, paywall, store, product, and duration.
- ✅ Group by: Renewal status, period, product, country, store, paywall, duration, attribution status, attribution channel, attribution campaign, attribution ad group, attribution ad set, and attribution creative.
You can find more information about the available controls, filters, grouping options, tax and commission controls, and how to use them in this documentation.
ARR chart usage
The Annual Recurring Revenue (ARR) chart is a valuable tool for measuring the growth and scale of your subscription-based business. It's a widely-used metric that provides a normalized view of your recurring revenue over a 12-month period. To gain a better understanding of what's driving your ARR, you can segment your data by key subscriber segments such as Store or Product Duration. By doing so, you can identify which segments are driving the most revenue, and optimize your business strategy accordingly.
Similar metrics
In addition to the ARR chart, Adapty also provides metrics for other revenue-related events, such as Revenue, MRR, ARPU, and ARPPU. To learn more about these revenue-related metrics, please refer to the following documentation guides:
Updated 12 days ago