
ARPPU
Average revenue per paying user
ARPPU
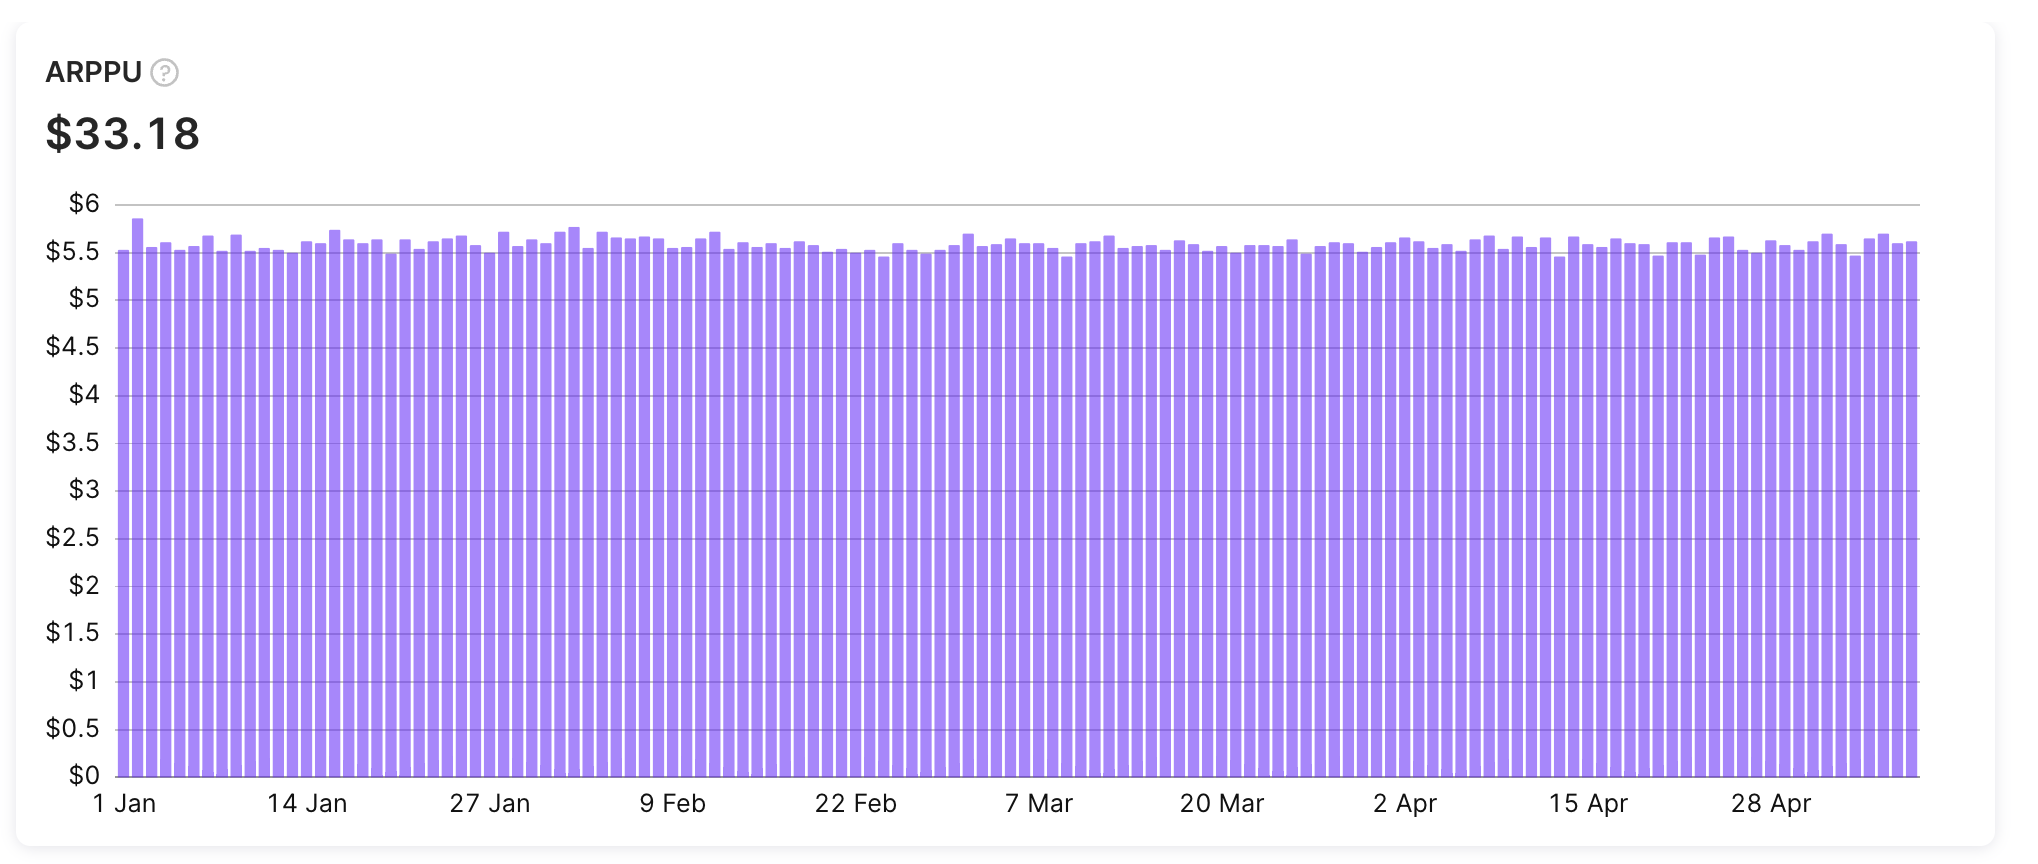
The Average revenue per paying user (ARPPU) chart displays the average revenue per paid user. It displays the actual revenue generated by paying customers, divided by the number of customers, minus refunds.
ARPPU chart
Calculation
The ARPPU chart is calculated as:
ARPPU = Revenue / Number of users who paid
For example, if your app generated $10,000 in revenue over a given period and had 500 paying customers during that time, the ARPPU would be calculated as $10,000 / 500 = $20. This means that on average, each paying customer generated $20 in revenue during the selected period.
It's important to note that the ARPPU value displayed represents the sum of total revenue divided by the total number of paying customers. The calculation is done before the store's fee and the refund amount is excluded from the revenue. As one user can pay more than one time during the whole period, the total ARPPU value may be higher than the daily value of ARPPU. This metric provides valuable insights into the revenue-generating capabilities of your app's paying user base and can help you optimize your pricing and subscription strategy to maximize revenue generation.
Available filters and grouping
- ✅ Filter by: Attribution, country, paywall, store, product, and duration.
- ✅ Group by: Renewal status, period, product, country, store, paywall, duration, attribution status, attribution channel, attribution campaign, attribution ad group, attribution ad set, and attribution creative.
You can find more information about the available controls, filters, grouping options, tax and commission controls, and how to use them in this documentation.
ARPPU chart usage
The ARPPU chart in Adapty is a powerful tool that can help businesses understand the revenue generated by each paying user. By analyzing this metric over time, businesses can identify which channels, networks, and campaigns attract the most valuable customers. This information can be used to optimize marketing strategies and increase revenue by targeting high-value customers. With Adapty's ARPPU chart, businesses can make data-driven decisions that improve their bottom line and drive long-term success.
Similar metrics
In addition to the ARPPU chart, Adapty also provides metrics for other revenue-related events, such as Revenue, MRR, ARR, and ARPU. To learn more about these revenue-related metrics, please refer to the following documentation guides:
Updated 12 days ago