
ARPU
Average revenue per user
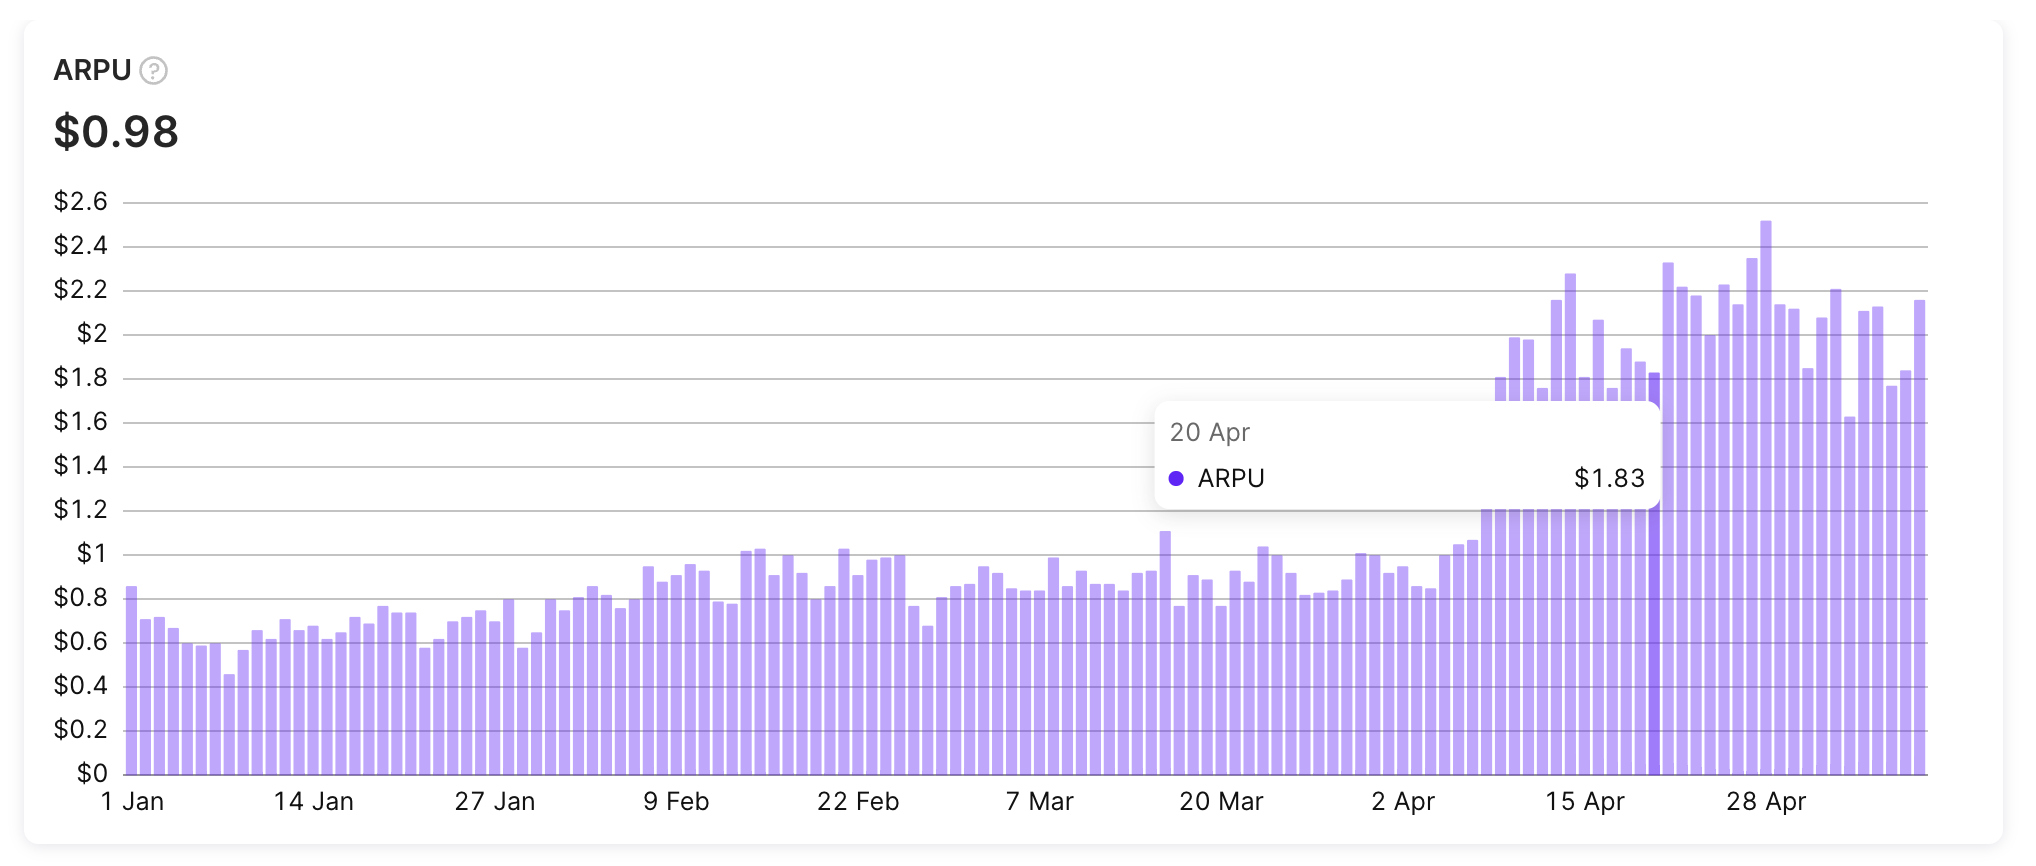
ARPU (average revenue per user) chart displays the average revenue generated per user for a given period. This metric is calculated by dividing the total revenue generated by a cohort of customers by the number of users in that cohort.
ARPU chart
Calculation
Adapty calculates the ARPU chart by dividing the total revenue earned over a given period by the number of non-unique users (installs) during the same period.
ARPU = Revenue / Number of new users
For instance, if your app generated $10,000 in revenue over the course of a week, and had 2,000 non-unique users during that same period, the ARPU for that week would be $5 ($10,000/2,000).
The calculation is done before the store's fee and the refund amount is excluded from the revenue.
Available filters and grouping
- ✅ Filter by: Attribution, country, and store.
- ✅ Group by: Country, store, attribution status, attribution channel, attribution campaign, attribution ad group, attribution ad set, and attribution creative.
You can find more information about the available controls, filters, grouping options, tax and commission controls, and how to use them in this documentation.
ARPU chart usage
ARPU chart usage is beneficial for businesses to track their overall revenue generation and understand how much revenue is being generated per user. By analyzing the ARPU chart, businesses can identify trends, patterns, and areas of improvement to optimize their revenue generation strategies. This can help businesses make data-driven decisions to increase their user engagement, target their marketing efforts, and improve their overall monetization strategy.
Similar metrics
In addition to the ARPU chart, Adapty also provides metrics for other revenue-related events, such as Revenue, MRR, ARR, and ARPU. To learn more about these revenue-related metrics, please refer to the following documentation guides:
Updated 12 days ago