
Placement metrics
With Adapty, you have the flexibility to create and manage multiple placements in your app, each associated with distinct paywalls or A/B tests. This versatility enables you to target specific user segments, experiment with different offers or pricing models, and optimize your app's monetization strategy.
To gather valuable insights into the performance of your placements and user engagement with your offers, Adapty tracks various user interactions and transactions related to the displayed paywalls. The robust analytics system captures metrics including views, unique views, purchases, trials, refunds, conversion rates, and revenue.
The collected metrics are continuously updated in real-time and can be conveniently accessed and analyzed through Adapty's user-friendly dashboard. You have the freedom to customize the time range for analysis, apply filters based on different parameters, and compare metrics across various placements, user segments, or products.
Placement metrics are available on the placements list, where you can get an overview of the performance of all your placements. This high-level view provides aggregated metrics for each placement, allowing you to compare their performance and identify trends.
For a more detailed analysis of each placements, you can navigate to the placements detail metrics. On this page, you will find comprehensive metrics specific to the selected placements. These metrics provide deeper insights into how a particular placements is performing, allowing you to assess its effectiveness and make data-driven decisions.
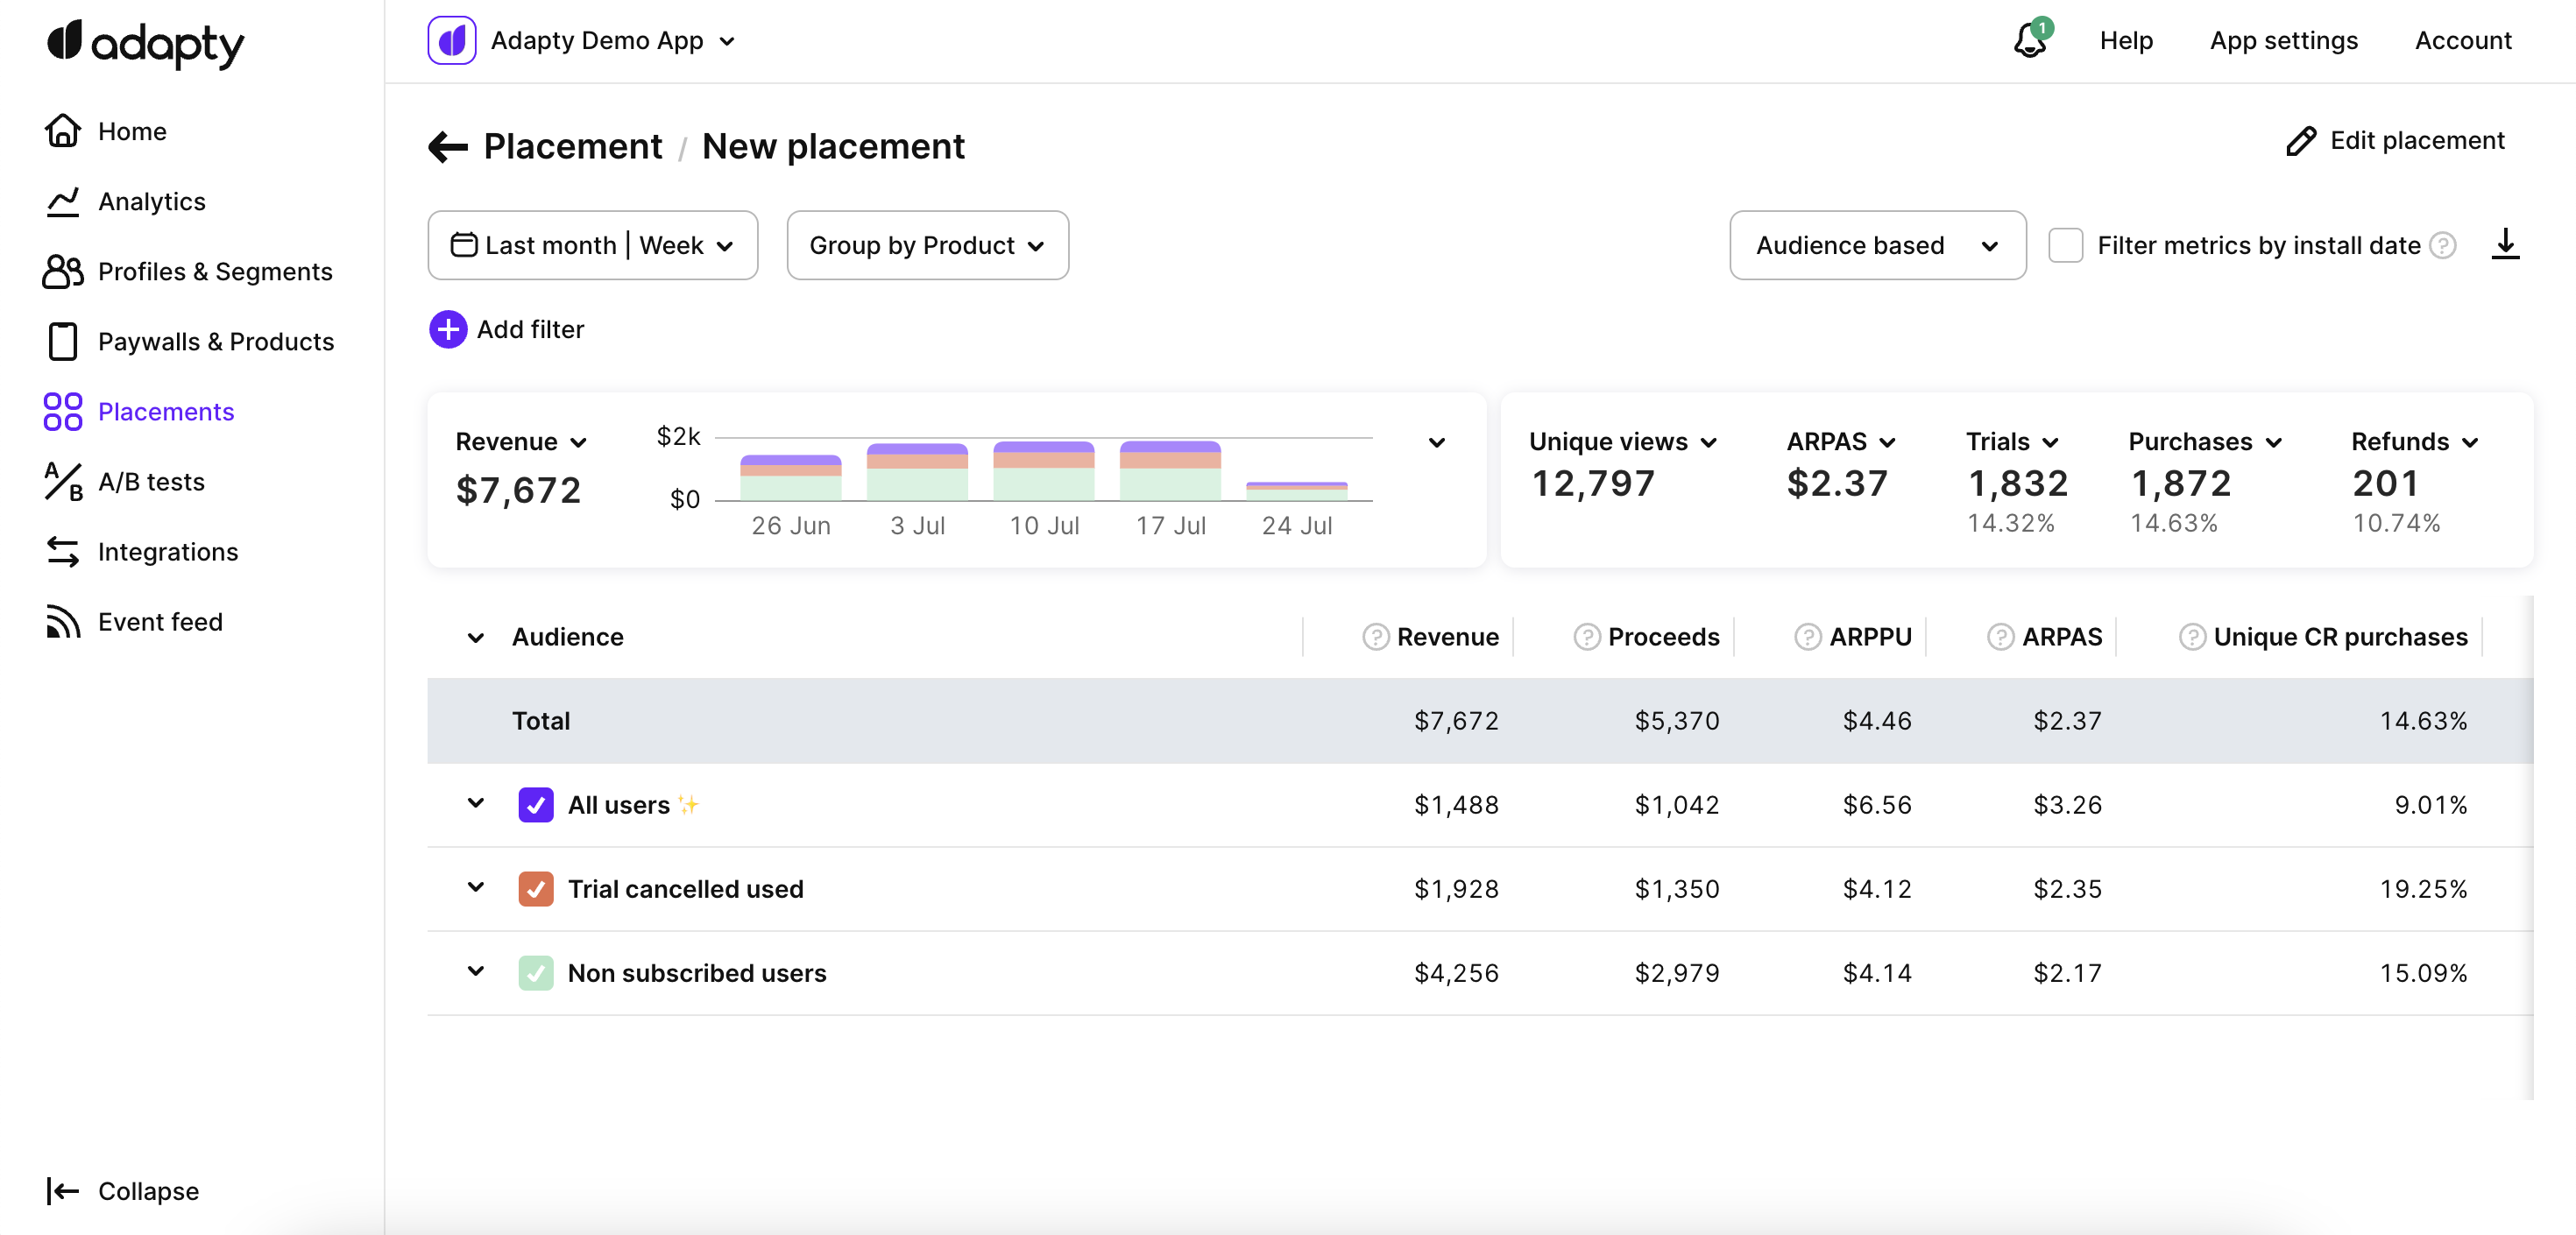
Placement metrics page
Metrics controls
The system displays the metrics based on the selected time period and organizes them according to the left-side column parameter with four levels of indentation.
View options for metrics data
The placement metrics page offers two view options for metrics data: paywall-based and audience-based.
View options for placement metrics
In the paywall-based view, metrics are grouped by placements associated with the paywall. This allows users to analyze metrics by different placements.
In the audience-based view, metrics are grouped by the target audience of the paywall. Users can assess metrics specific to different audience segments.
Profile install date filtration
Filter placement metrics by the installation date
Time ranges
You can choose from a range of time periods to analyze metrics data, allowing you to focus on specific durations such as days, weeks, months, or custom date ranges.
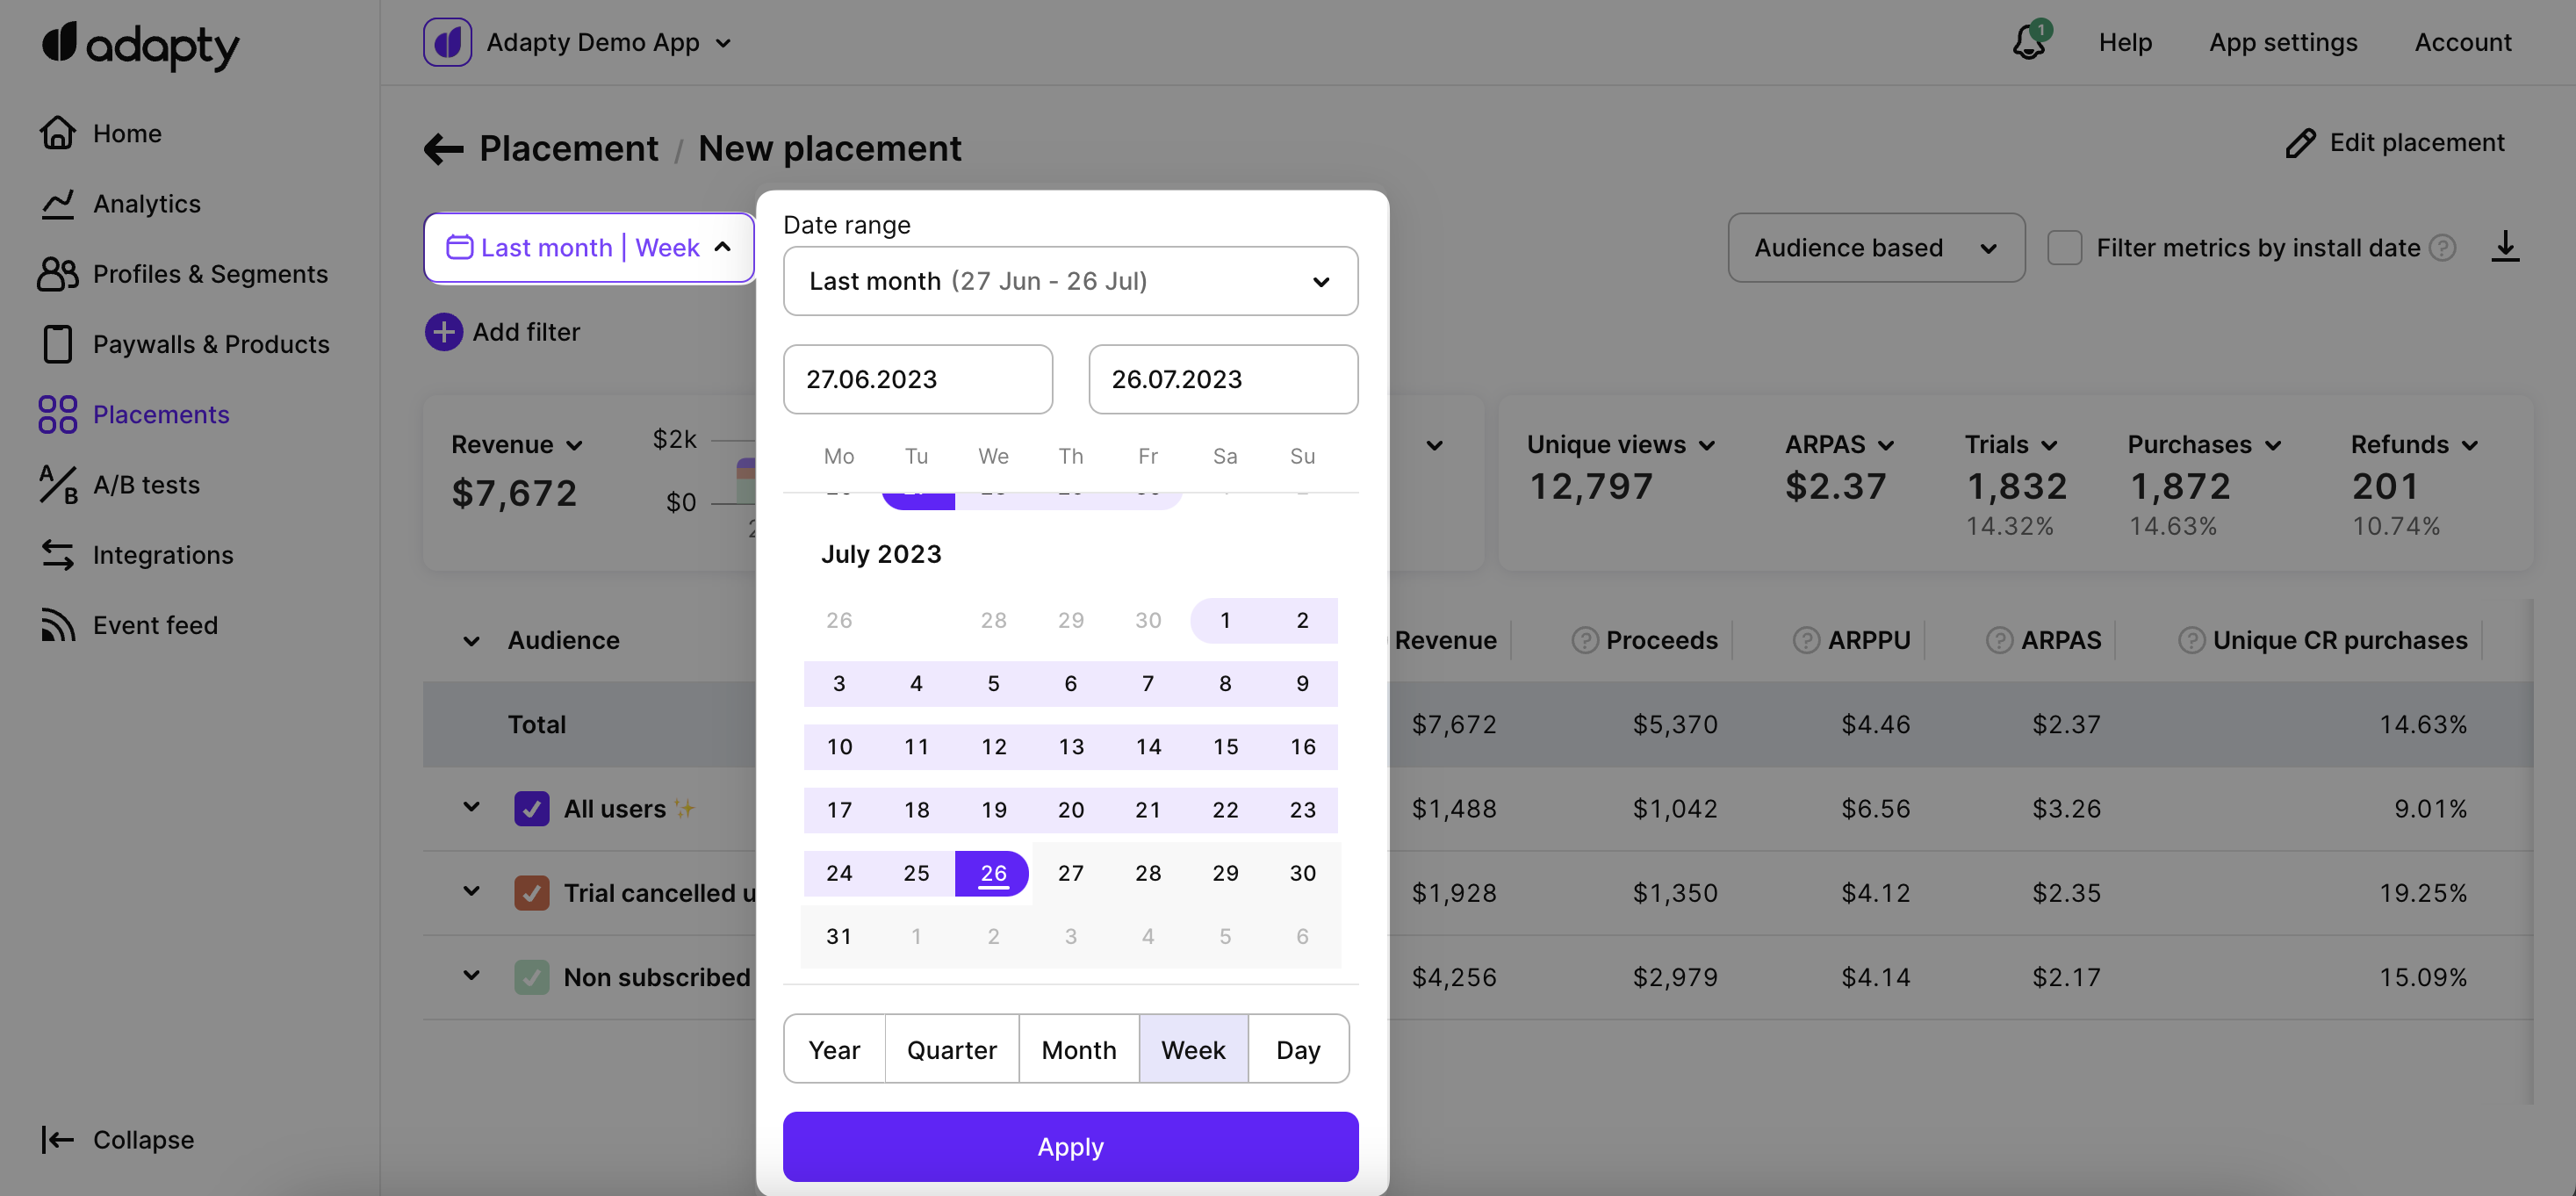
Time range filtering for placement metrics
Available filters and grouping
Adapty offers powerful tools for filtering and customizing metrics analysis to suit your needs. With Adapty's metrics page, you have access to various time ranges, grouping options, and filtering possibilities.
- ✅ Filter by: Audience, paywall, paywall group, placement, country, store.
- ✅ Group by: Segment, store, and product
You can find more information about the available controls, filters, grouping options, and how to use them for paywall analytics in this documentation.
Single metrics chart
One of the key components of the placement metrics page is the chart section, which visually represents the selected metrics and facilitates easy analysis.
The chart section on the placements metrics page includes a horizontal bar chart that visually represents the chosen metric values. Each bar in the chart corresponds to a metric value and is proportional in size, making it easy to understand the data at a glance. The horizontal line indicates the timeframe being analyzed, and the vertical column displays the numeric values of the metrics. The total value of all the metric values is displayed next to the chart.
Single metrics chart in the placement metrics page
Additionally, clicking on the arrow icon in the top right corner of the chart section expands the view, displaying the selected metrics on the full line of the chart.
Total metrics summary
Next to the single metrics chart, the total metrics summary section is shown, which displays the cumulative values for the selected metrics at a specific point in time, with the ability for you to change the displayed metric using a dropdown menu.
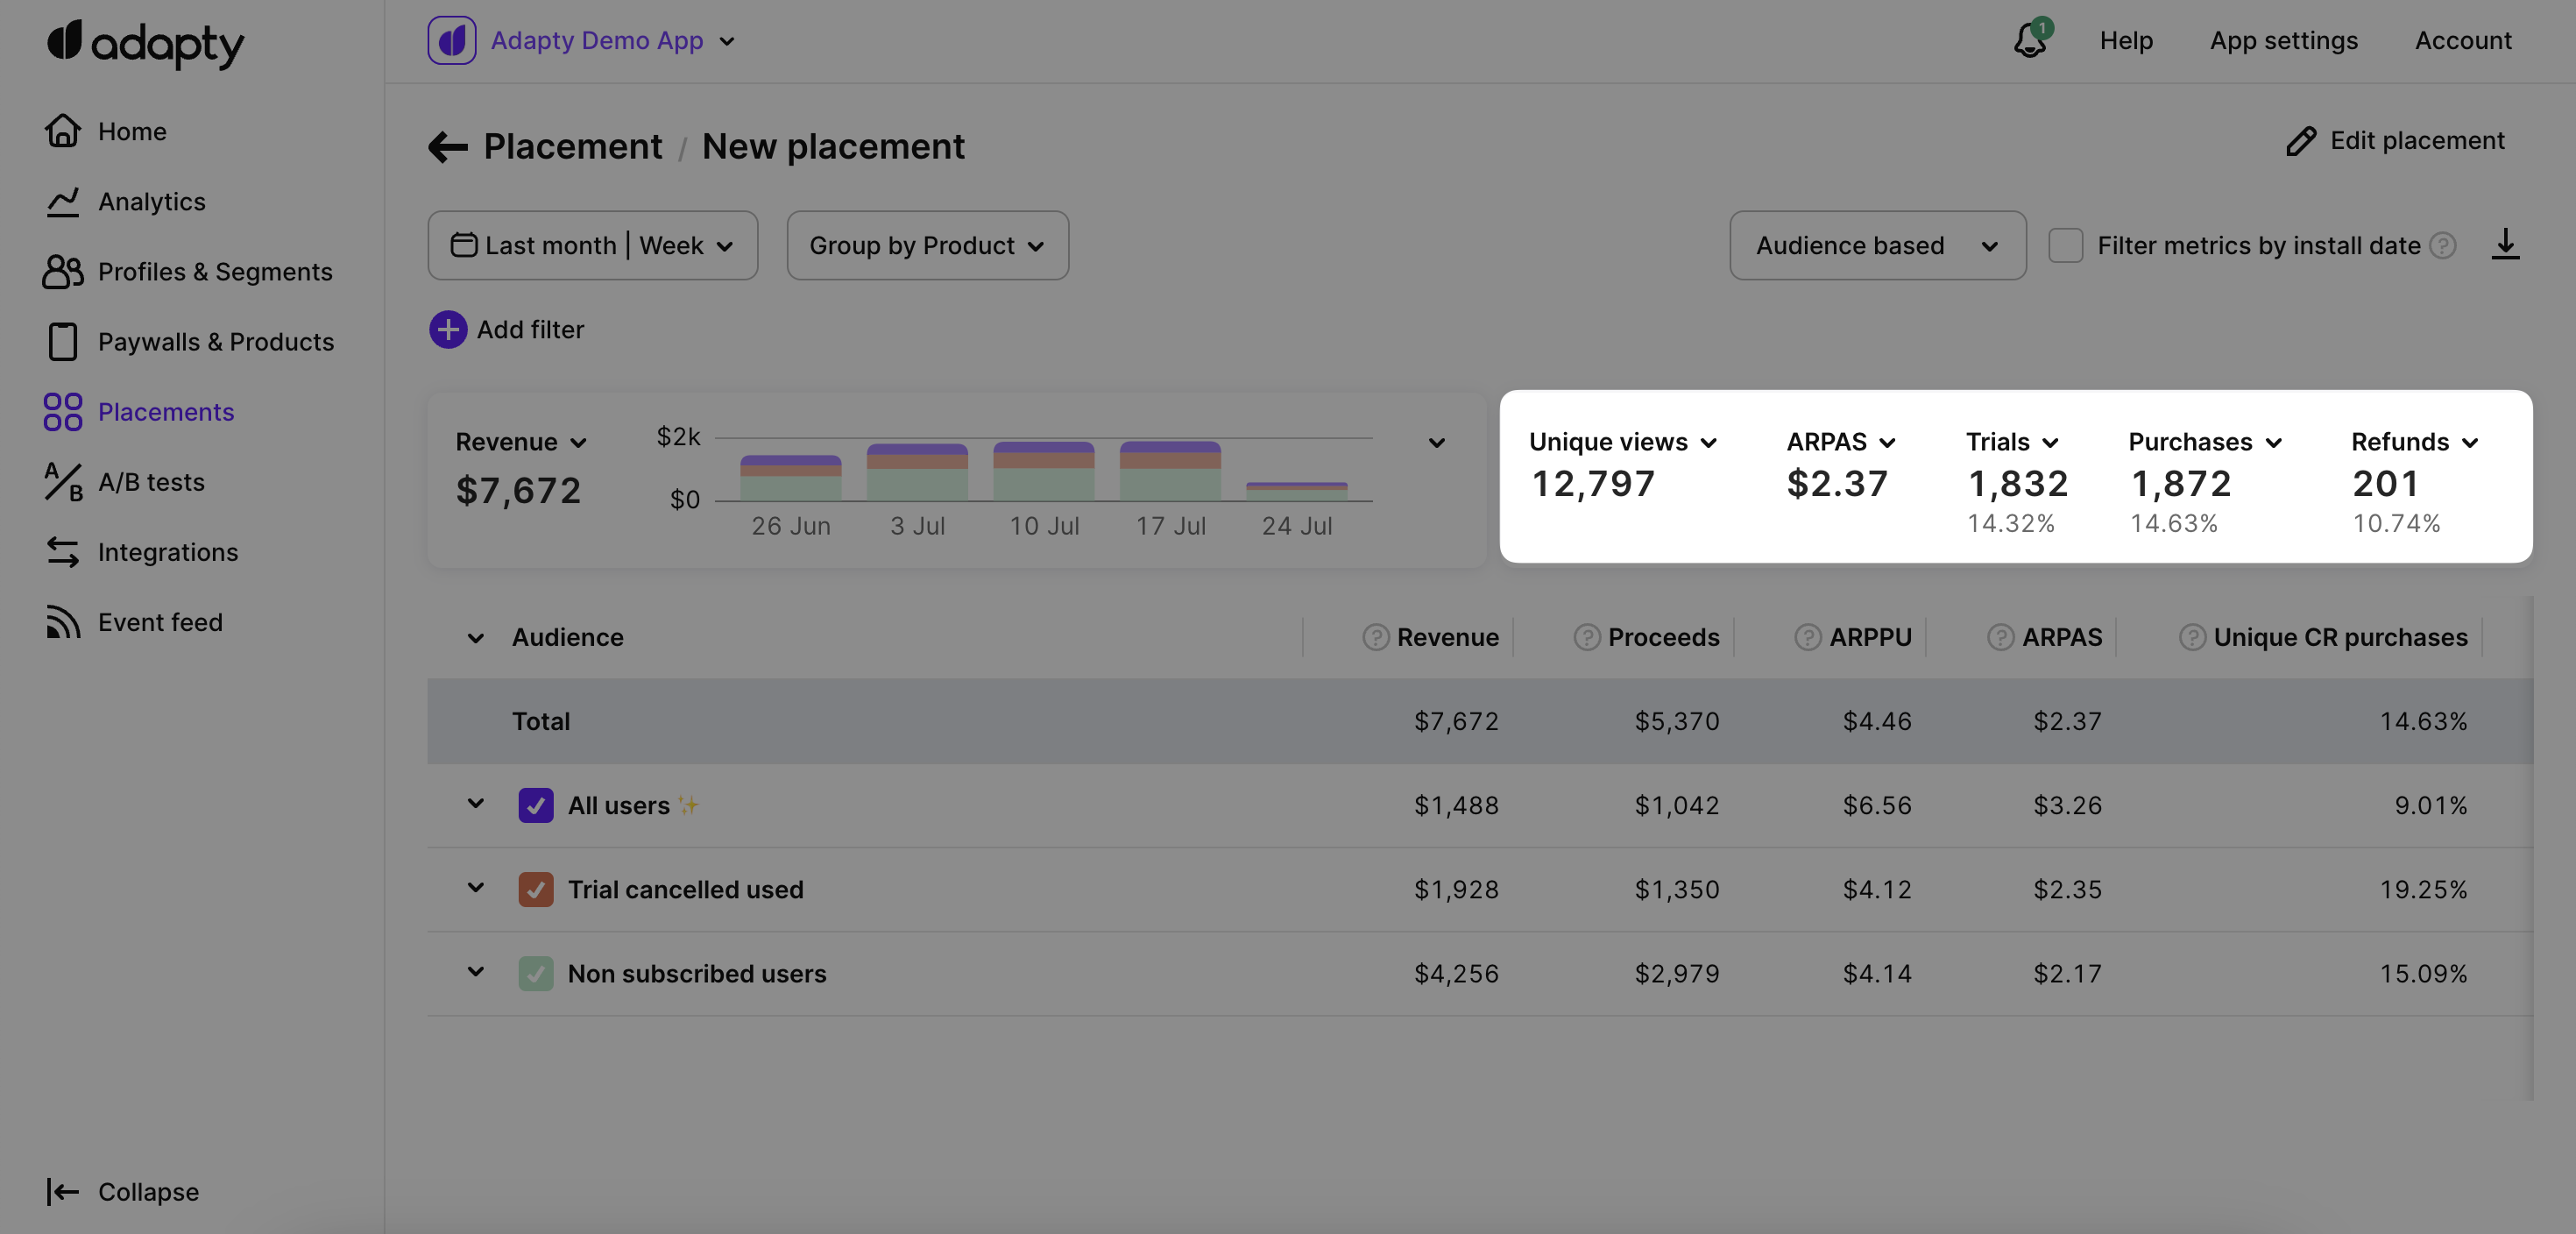
Total values of metrics in the placement metrics page
Metrics definitions
Unlock the power of placement metrics with our comprehensive definitions. From revenue to conversion rates, gain valuable insights that will supercharge your monetization strategies and drive success for your app.
Placement metrics
Revenue
This metric represents the total amount of money generated in USD from purchases and renewals within specific placements. Please note that the revenue calculation does not include the Apple App Store or Google Play Store commission and is calculated before deducting any fees.
Proceeds
This metric represents the actual amount of money received by the app owner in USD from purchases and renewals within specific placements after deducting the applicable Apple App Store or Google Play Store commission. It reflects the net revenue that directly contributes to the app's earnings. For more information on how proceeds are calculated, you can refer to the Adapty documentation.
ARPPU
ARPPU stands for Average revenue per paying user and measures the average revenue generated per paying user within specific placements. It is calculated as the total revenue divided by the number of unique paying users. For example, if the total revenue is $15,000 and there are 1,000 paying users, the ARPPU would be $15.
ARPAS
ARPAS, or Average revenue per active subscriber, allows you to measure the average revenue generated per active subscriber within specific placements. It is calculated by dividing the total revenue by the number of subscribers who have activated a trial or subscription. For example, if the total revenue is $5,000 and there are 1,000 subscribers, the ARPAS would be $5. This metric helps assess the average monetization potential per subscriber.
Unique CR to purchases
The Unique conversion rate to purchases is calculated by dividing the number of purchases within specific placements by the number of unique views. It focuses on the ratio of purchases to the unique number of views, providing insights into the effectiveness of converting unique visitors within specific placements into paying customers.
CR to purchases
The Conversion rate to purchases is calculated by dividing the number of purchases within specific placements by the total number of views of paywalls. It indicates the percentage of views within specific placements that result in purchases, providing insights into the effectiveness of your paywall in converting users into paying customers.
Unique CR to trials
The unique conversion rate to trials is calculated by dividing the number of trials started within specific placements by the number of unique views. It measures the percentage of unique views within specific placements that result in trial activations, providing insights into the effectiveness of your paywall in converting unique visitors into trial users.
Purchases
Purchases represent the cumulative total of various transactions made on the paywall within specific placements. The following transactions are included in this metric (renewals are not included):
- New purchases are made directly within specific placements.
- Trial conversions of trials that were initially activated within specific placements.
- Downgrades, upgrades, and cross-grades of subscriptions made within specific placements.
- Subscription restores within specific placements, such as when a subscription is reinstated after expiration without auto-renewal.
By considering these different types of transactions, the purchases metric provides a comprehensive view of the overall acquisition and monetization activity within specific placements.
Trials
The trials metric represents the total number of trials that have been activated within specific placements. It reflects the number of users who have initiated trial periods through your paywall within those placements. This metric helps track the effectiveness of your trial offering and can provide insights into user engagement and conversion from trials to paid subscriptions.
Trials canceled
The trials canceled metric represents the number of trials within specific placements in which the auto-renewal feature has been switched off. This occurs when users manually unsubscribe from the trial, indicating their decision not to continue with the subscription after the trial period ends. Tracking trials canceled provides valuable information about user behavior and allows you to understand the rate at which users opt out of the trial within specific placements.
Refunds
The refunds metric represents the number of refunded purchases and subscriptions within specific placements. This includes transactions that have been reversed or refunded due to various reasons, such as customer requests, payment issues, or any other applicable refund policies.
Refund rate
The refund rate is calculated by dividing the number of refunds within specific placements by the number of first-time purchases (renewals are not included). For example, if there are 5 refunds and 1,000 first-time purchases, the refund rate would be 0.5%.
Views
The views metric represents the total number of times the paywall within specific placements has been viewed by users. Each time a user visits the paywall within those placements, it is counted as a separate view. Tracking views helps you understand the level of engagement and user interaction with your paywall, providing insights into user behavior and the effectiveness of your paywall placement and design within specific areas of your app.
Unique views
The unique views metric represents the number of unique instances in which the paywall within specific placements has been viewed by users. Unlike total views, which count each visit as a separate view, unique views count each user's visit to the paywall within those placements only once, regardless of how many times they access it. Tracking unique views helps provide a more accurate measure of user engagement and the reach of your paywall within specific placements, as it focuses on individual users rather than the total number of visits.
Updated 5 months ago