
Charts
Out-of-the-box ready subscription analytics for most important metrics: MRR, revenue, trials, cancellations, purchases, ARPPU. All platforms: iOS, Android, Web
Install Adapty SDK and start analyzing real-time metrics of your iOS or Android app with advanced filters and grouping, such as ad network, ad campaign, country, paywall, product, and more.

Adapty Charts
Controls that make data informative
For all the charts in Adapty, you can use a range of controls to get more data-based insights.
1. Time ranges and comparison.
When you set a time range for a chart in the Adapty calendar, you have several quick options to choose from.
- Last 7 days
- Last month - from the current date to the same day in the previous month
- Last 28 days - useful for tracking weekly subscription products
- Last 3 months
- Last 6 months
- Last year
- Previous month - the full calendar month before the current
- This month - from the 1st day of the current month till today
- This quarter - from the 1st day of the current quarter till today
- This year - from the 1st day of the current year till today
Also, you can select the Custom option to set any period you need.
We have 2 formats of date and time - American and European. You can set one of them in your Adapty account as described here.

Choose a range from a list or set your custom
To evaluate the dynamic of your app's metrics we recommend using the comparison located next to the calendar.
The easiest way to use it is just by choosing to compare to the previous period. Though you may also customize your range of comparison according to your needs.
How can one read the comparison insights?
- When you choose the comparison period you can switch an on/off toggle to show the comparison on the chart or only as a number.
- We show the difference between your current result and the result of the previous period as a green or red number for the higher and lower results accordingly.
- If you have no grouping or only one grouping selected the comparison will be also shown on the chart. You can choose the type of chart - area, line, column - to make the visual difference more obvious.
- Hover on the chart and take a look at the details in an appearing tooltip.
- You can see both multiple grouping and comparison at the same time on one chart for a specific type of chart - columns.

See comparison on a chart or just as a number
2. Filters and grouping.

Metrics
Advanced Analytics allows you to track the following metrics.
Revenue
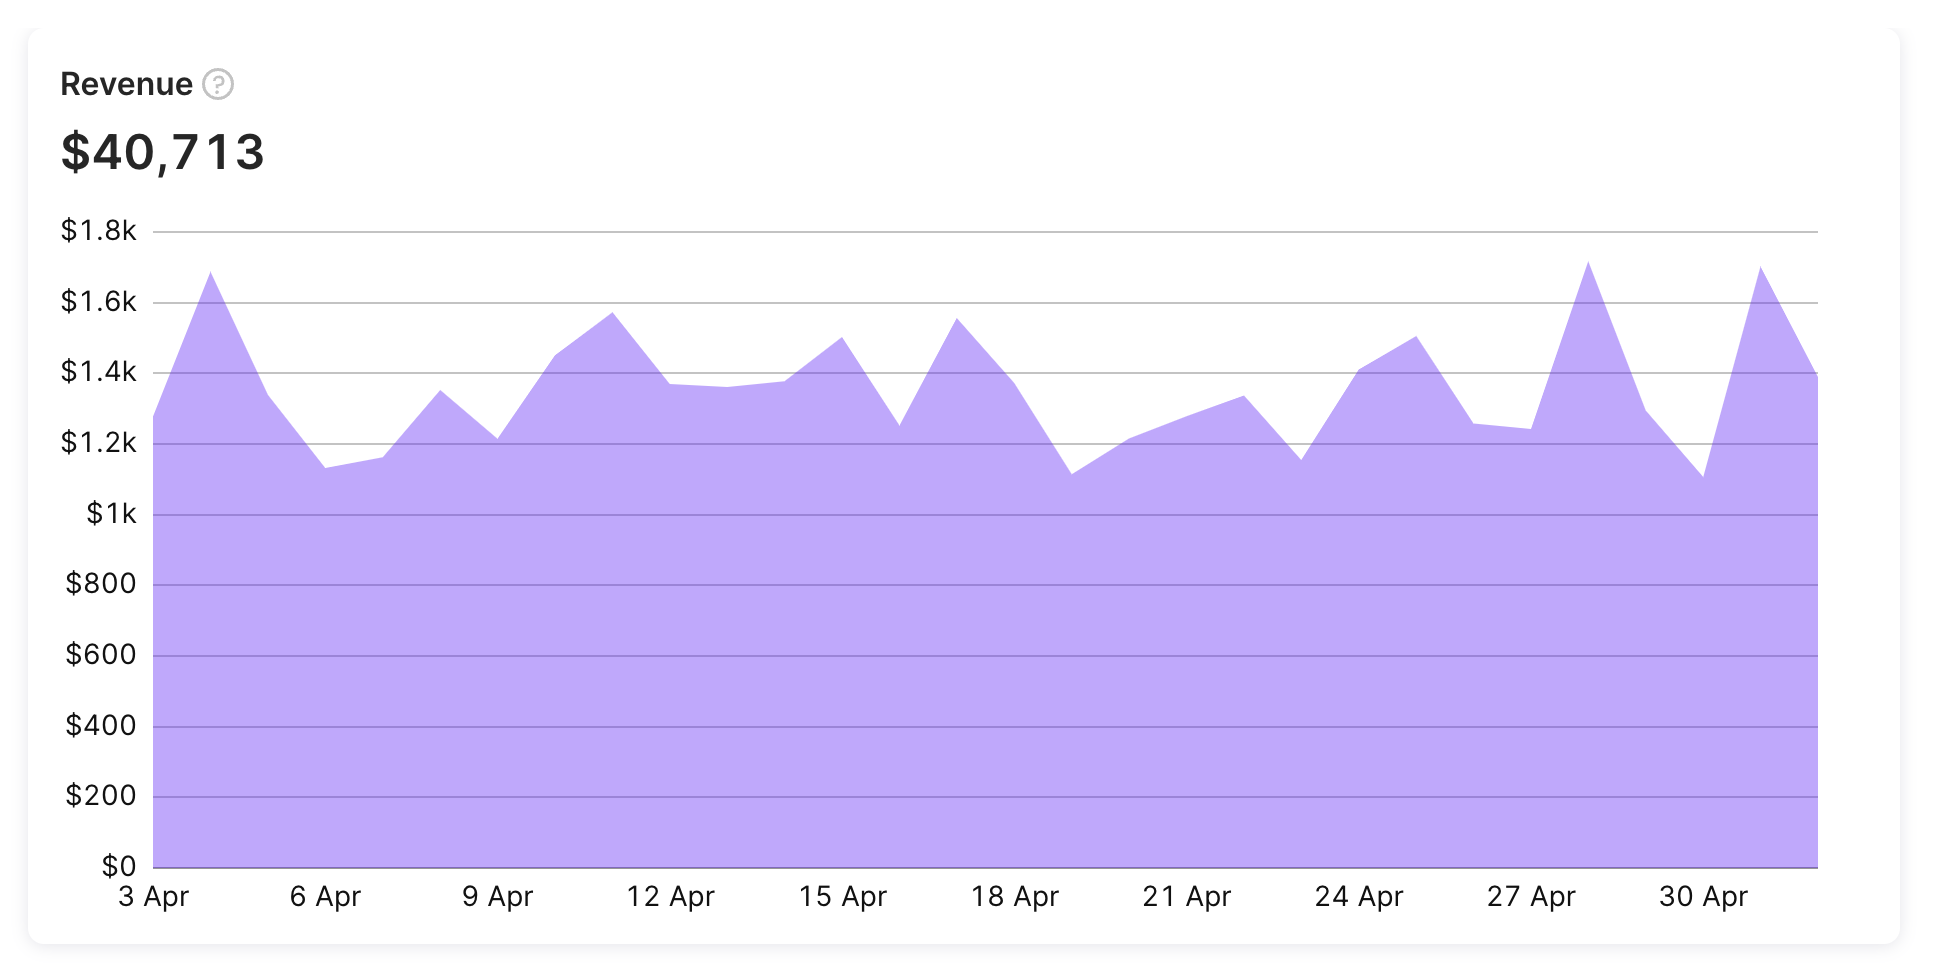
Total money received from both subscriptions and one-time purchases. Does not include revenue from subscriptions and purchases that were refunded afterward.
Monthly Recurring Revenue (MRR)
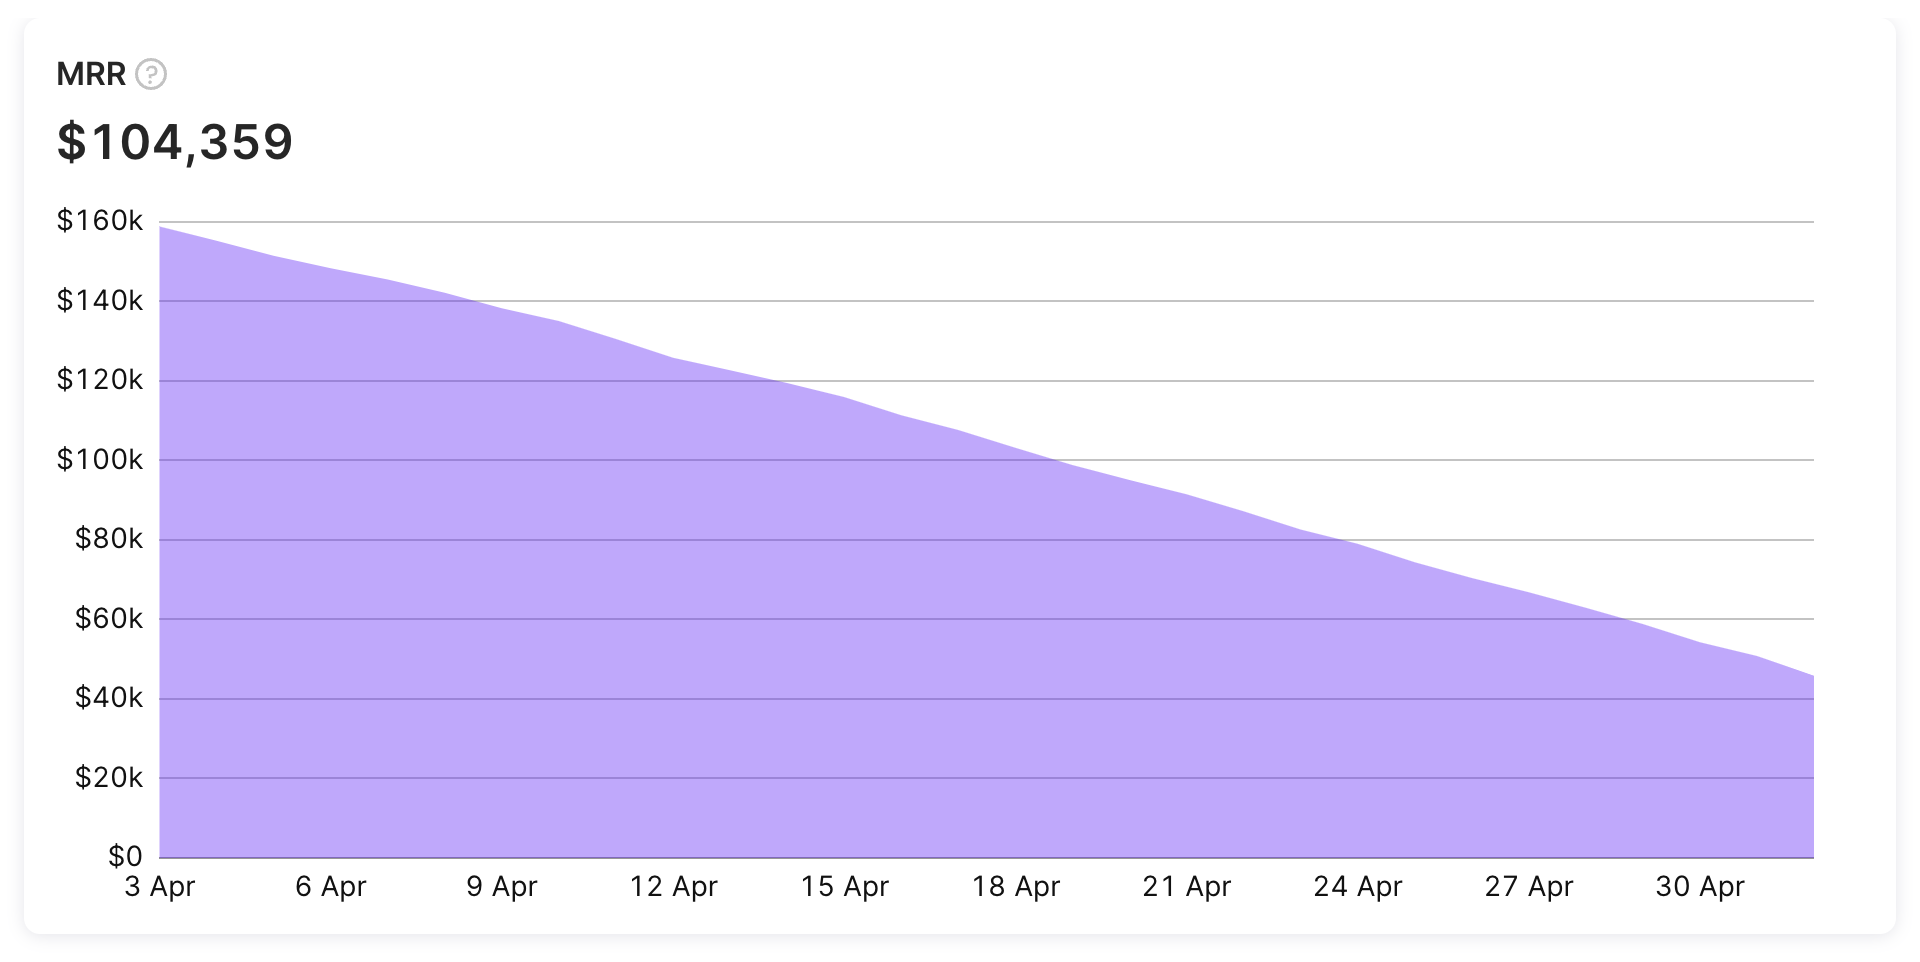
The measure of the predictable and recurring revenue components of your subscription business. Calculated as following:

Where:
Ps - subscription price
Ns - number of active paid subscriptions for this subscription
Dsm - subscription duration in months (0.25 for weekly subscriptions)
Basically, MRR shows revenue from all active subscriptions normalized to one month. For example, for a yearly subscription, instead of counting full revenue from the start, revenue is split into 12 equal parts which are evenly spread across 12 month period.
E.g. if there are 2 active yearly subscriptions with price $240 and 10 monthly subscriptions with price $30,
MMR = 240 2 / 12 + 30 10 / 1 = $340
ARPU
ARPU chart displays the average revenue per user (ARPU) for your app. ARPU is calculated as revenue for a given period / users (non-unique installs) for the same period. For example, if your app generates $10,000 in revenue in a day and has 1,000 new users on that day, the ARPU for that day would be $10 ($10,000/1,000).
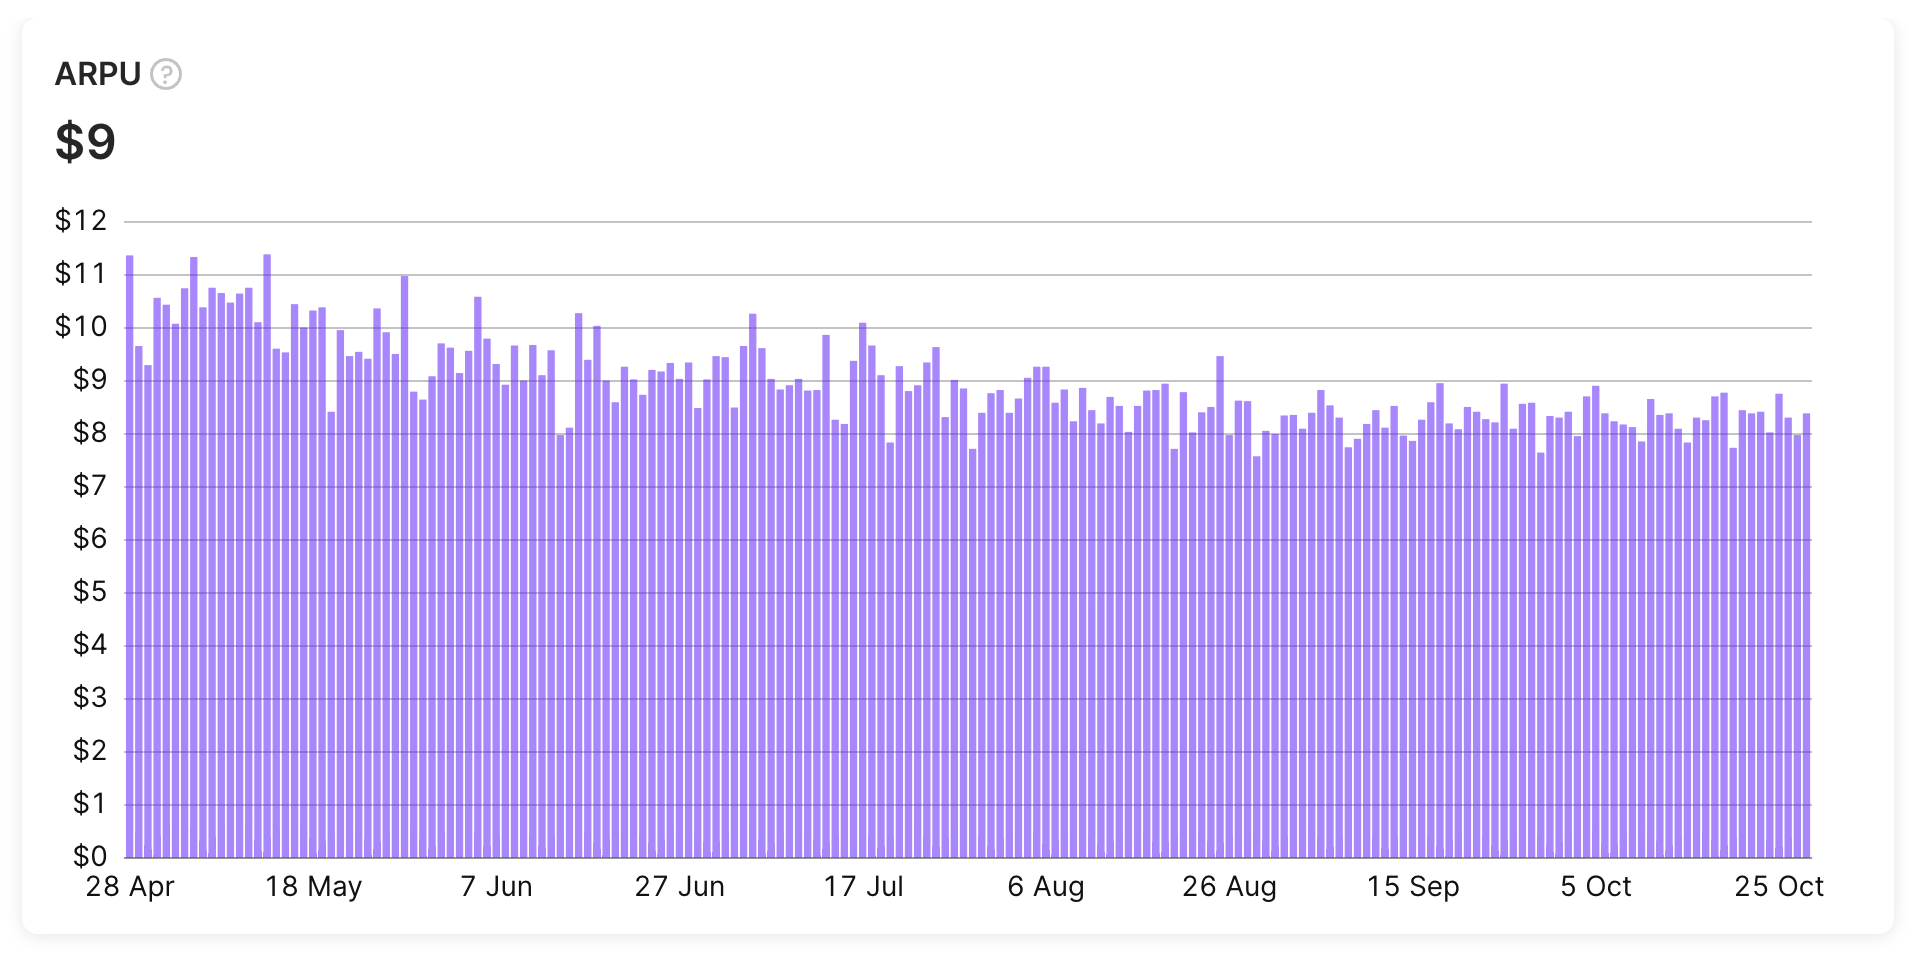
ARPU chart
The ARPU metric provides insight into the financial performance of your app and can be used to identify trends and track changes in revenue over time.
ARPPU
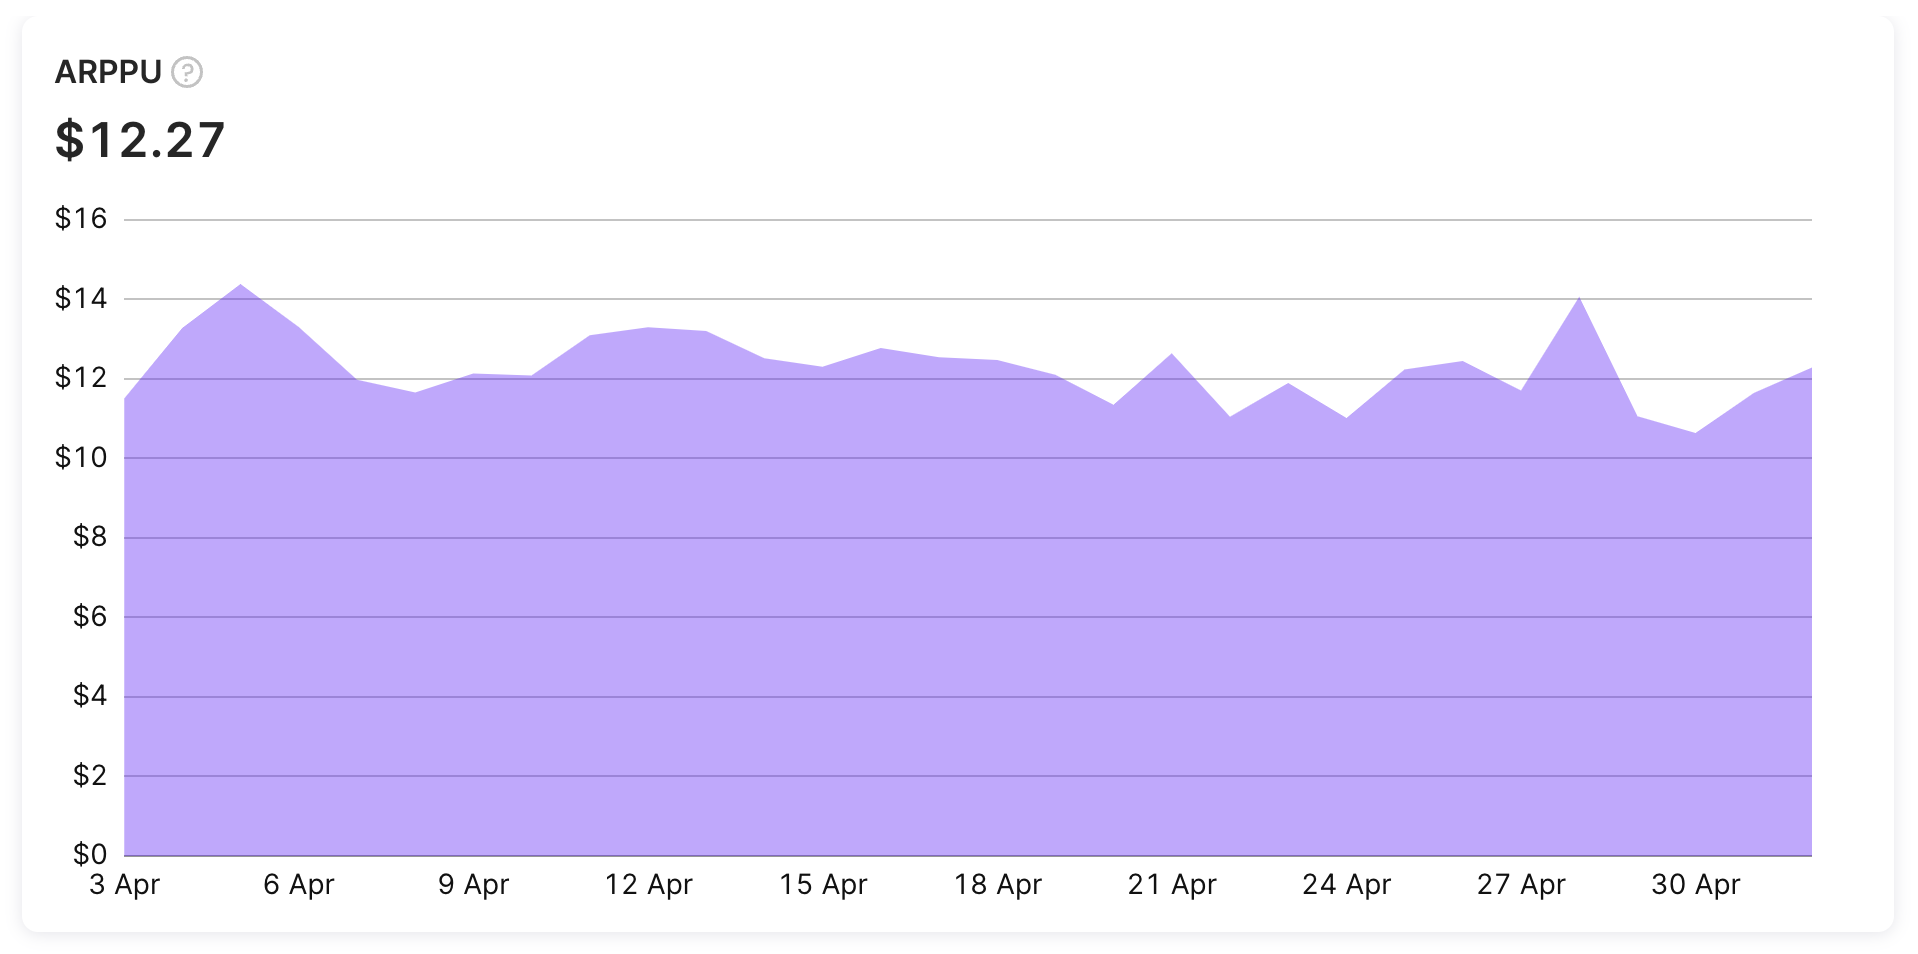
An average revenue per paid user. Calculated as revenue / number of users who paid
If revenue this day is $1000, and there were 50 users who made at least one purchase,
ARPPU = 1000 / 50 = $20.
Installs
The Installs chart shows the total number of users who have installed the app for the first time, as well as any reinstalls by existing users. This includes multiple installations by the same user on different devices. Please note that incomplete downloads or installations that are canceled before completion are not counted toward the install count.
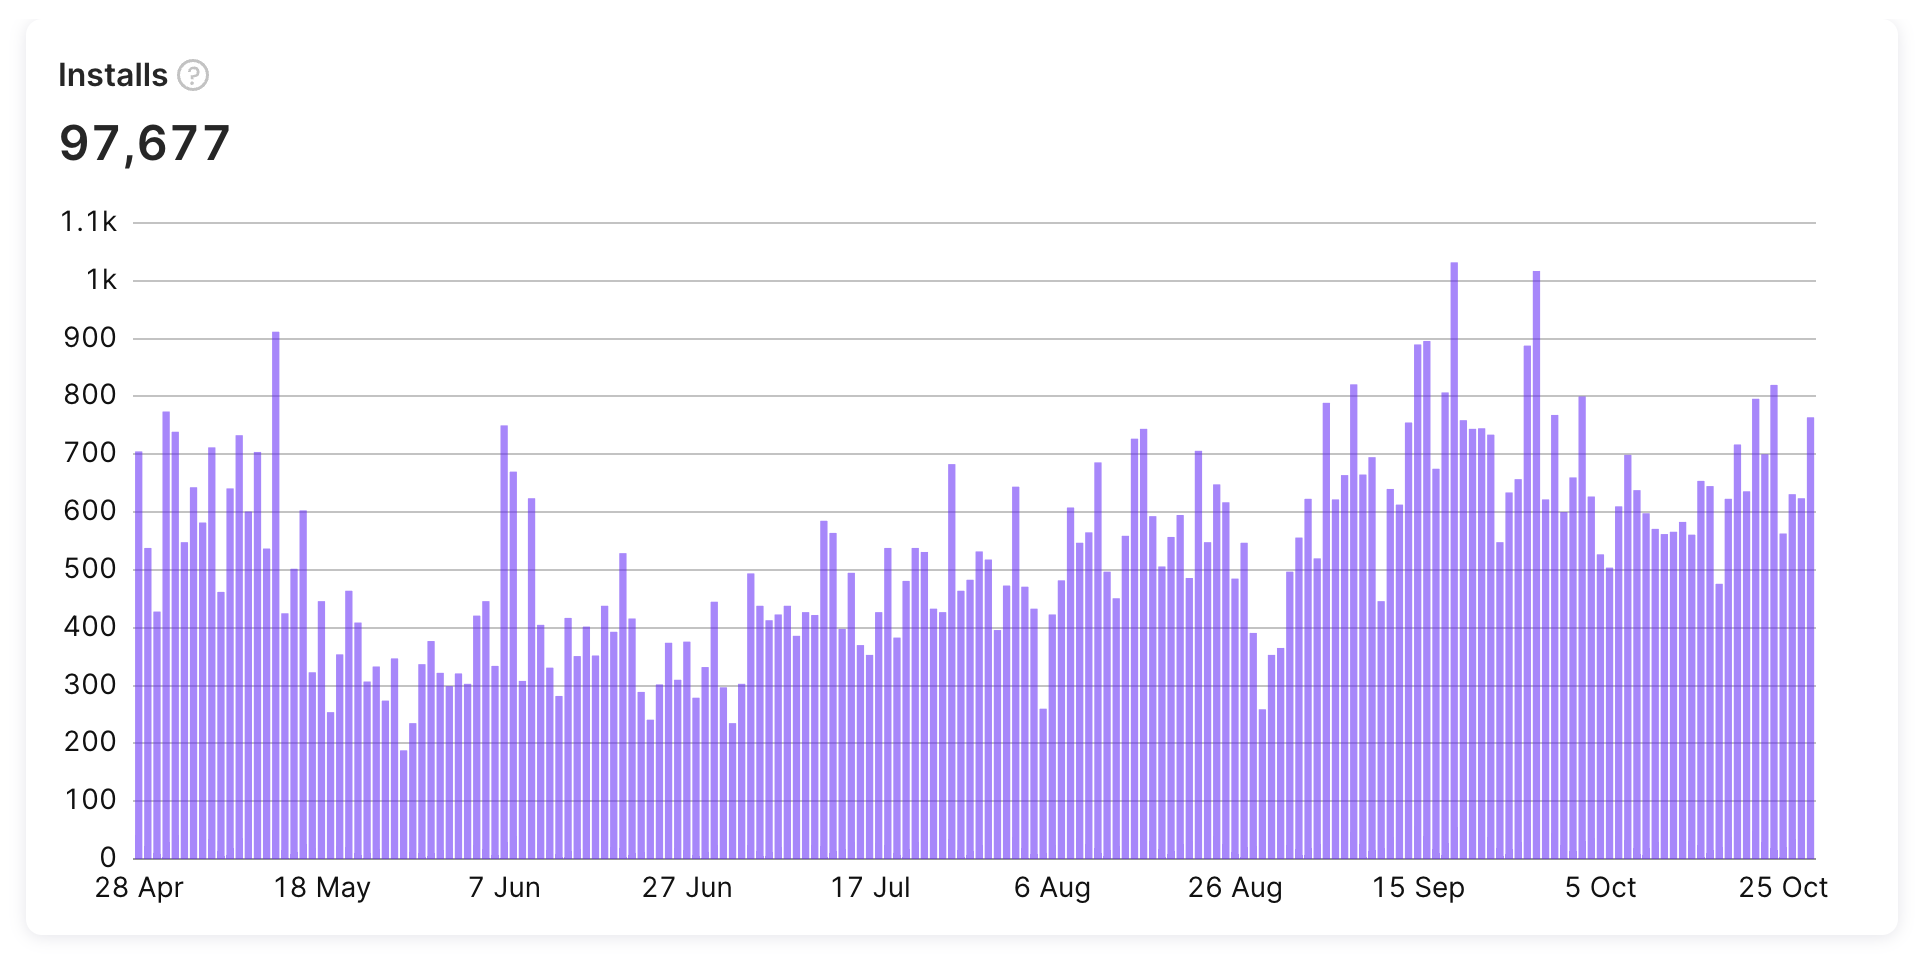
Please note that If your app has in-app user authentication, the Installs chart may also include the count of new logged-in users who have accessed your app multiple times. For more details please check our SDK documentation for identifying users.
Subscriptions
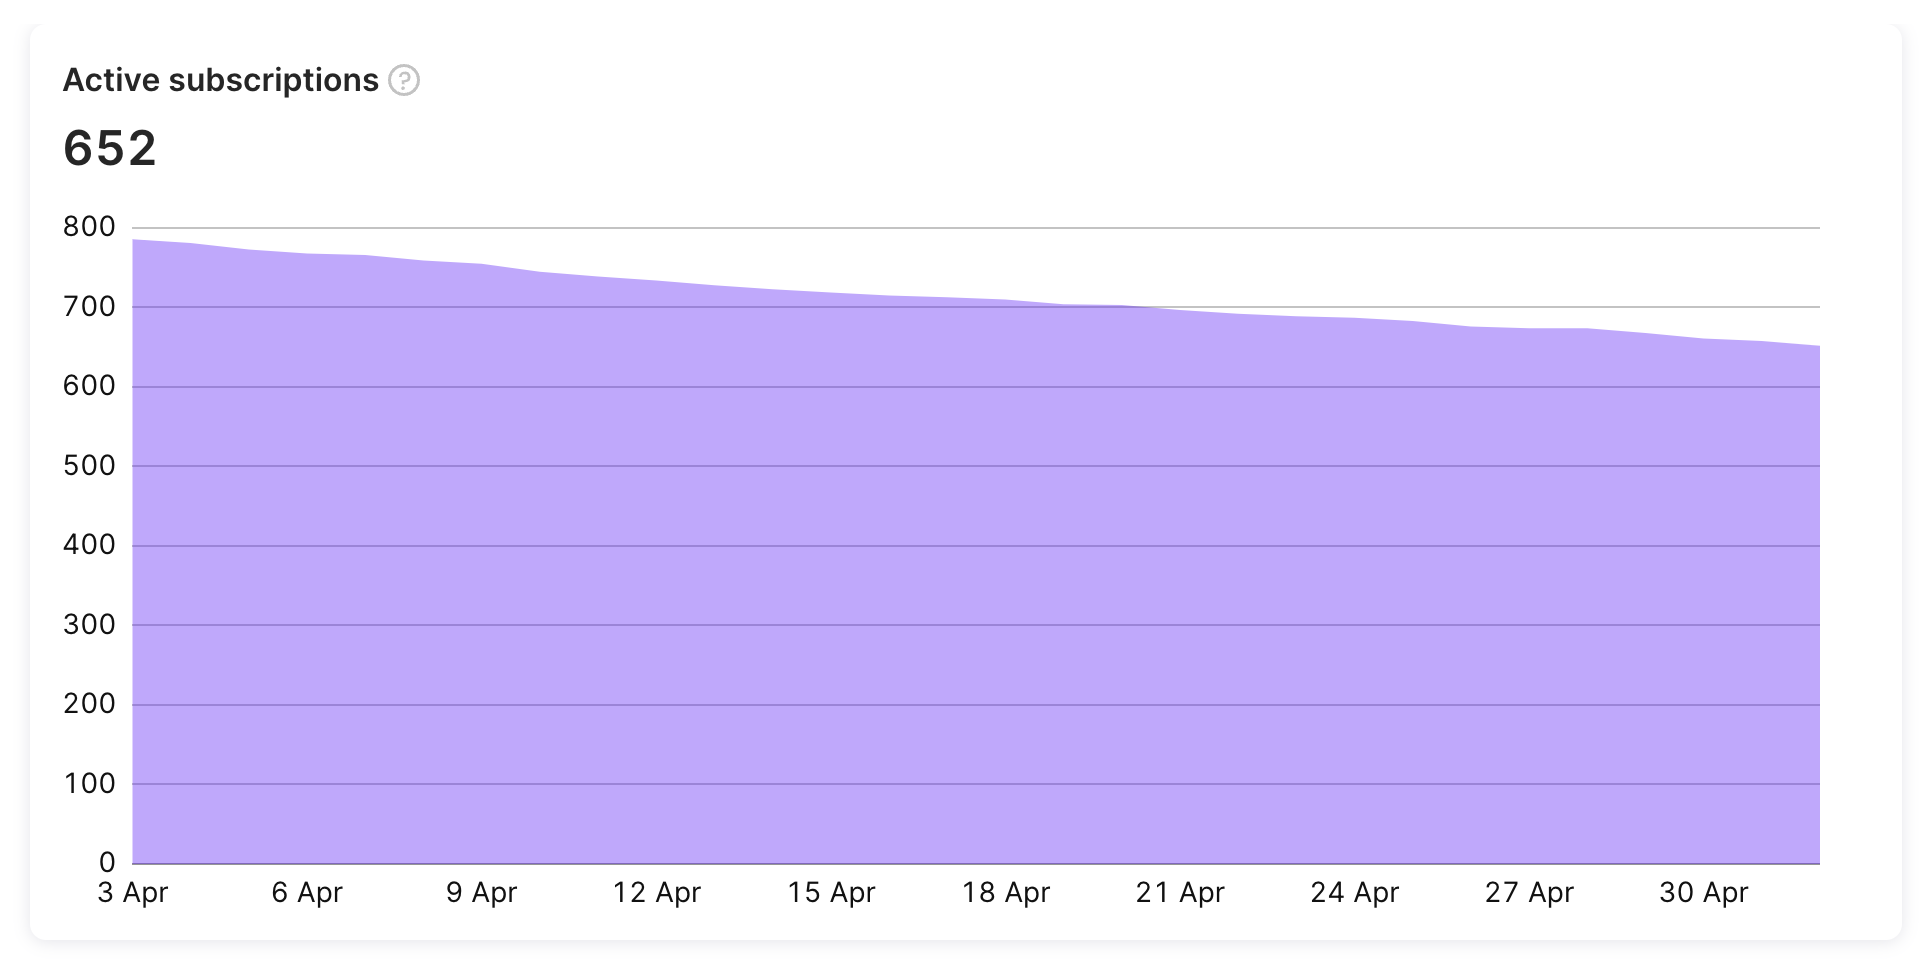
Active Subscriptions
The number of currently active subscriptions.
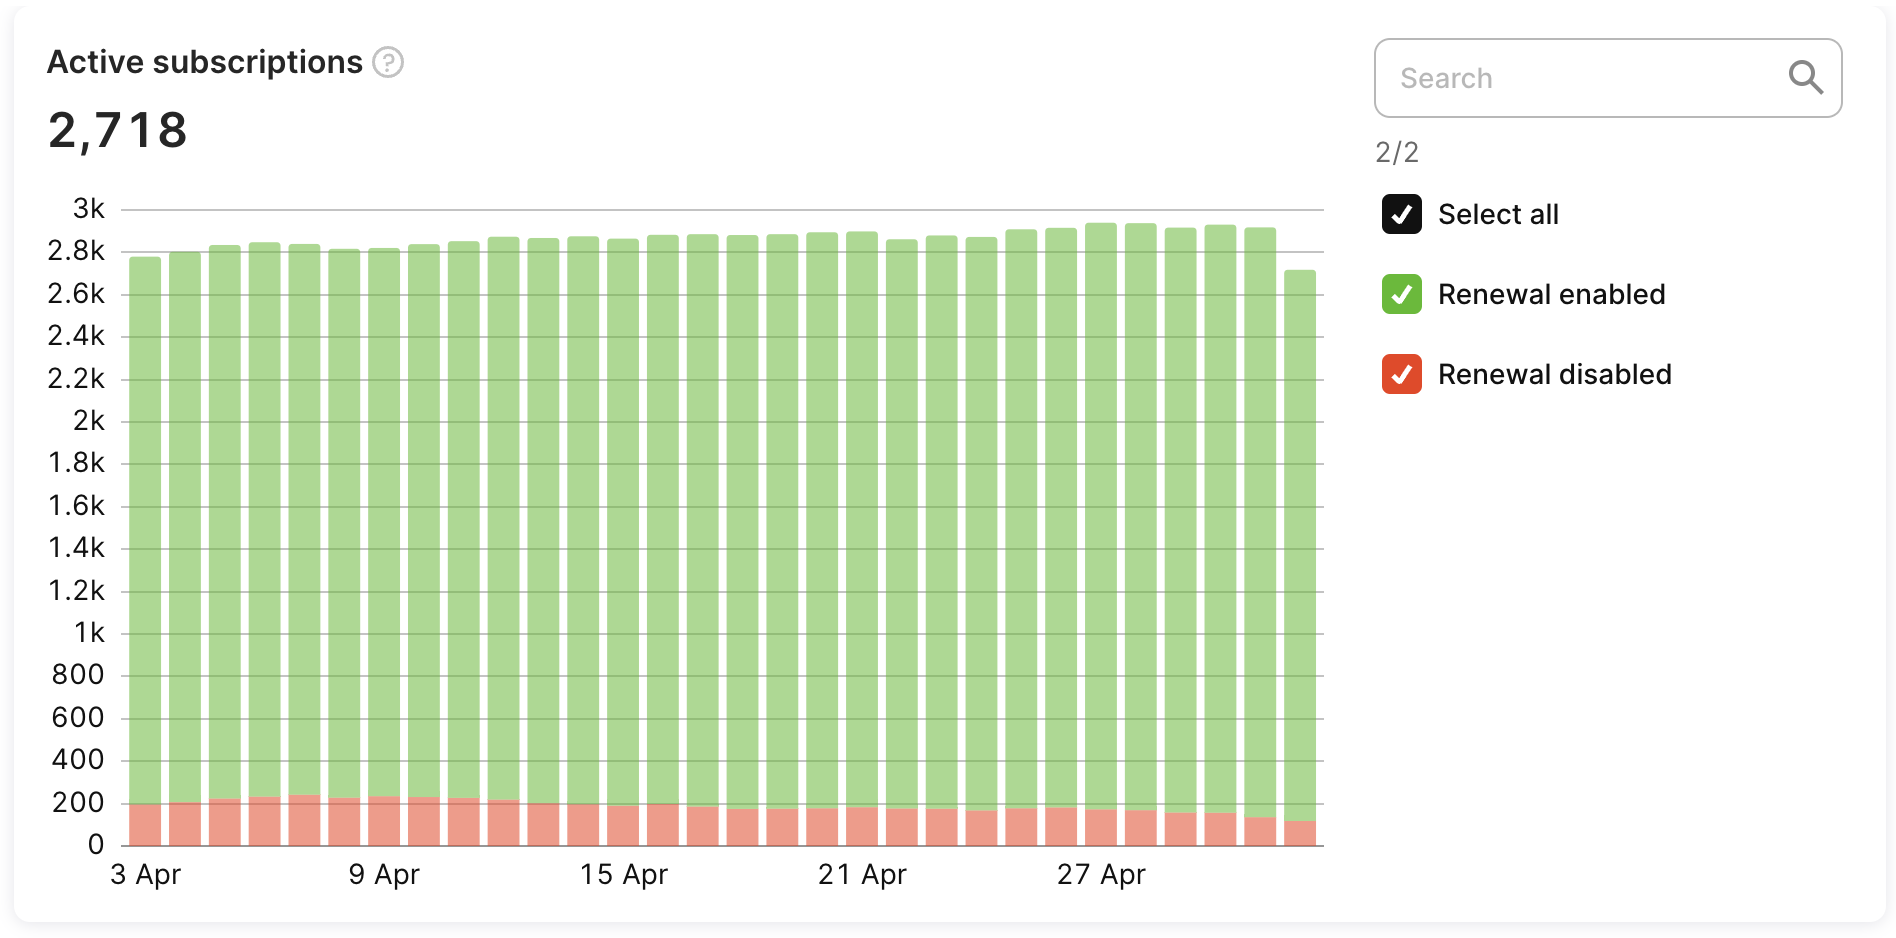
Subscriptions by renewal status
The number of active subscriptions segmented by renewal status, which indicates whether or not this subscription will be renewed in the next period.
Cancelled Subscriptions
The number of subscriptions auto-renew status of which was switched off (canceled by user). When the auto-renew status for the subscription is off, this means that this subscription won't be automatically renewed to the next period, yet the user still has premium features until the end of the current period.

Churned (Expired) Subscriptions
The number of subscriptions that expired, i.e. the user has no access to the premium features of the app, in contrast to the canceled subscriptions. Usually, it means that the user has decided to stop paying for the app or encountered a billing issue.

Reactivated Subscriptions
The number of subscriptions auto-renew status of which was switched on (reactivated by user). When the auto-renew status for the subscription is on, this means that this subscription will be automatically renewed to the next period in the future.

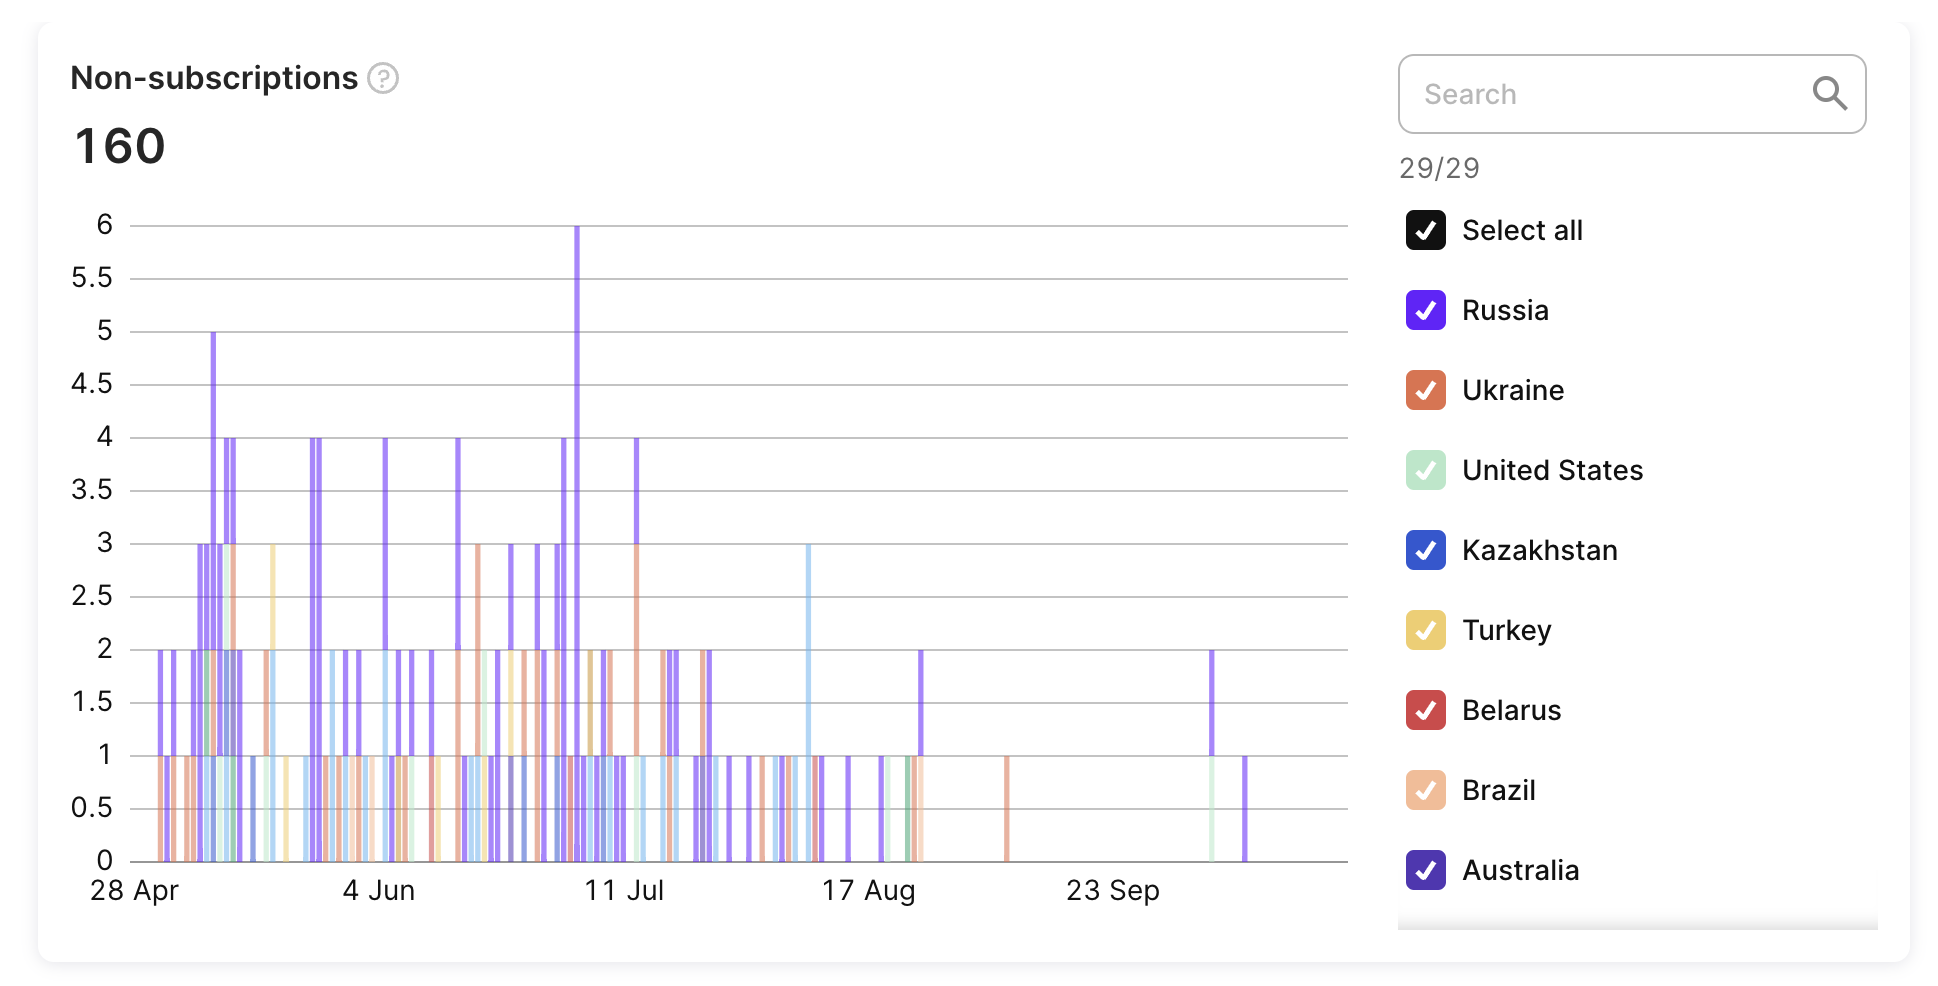
Non-subscriptions
The Non-subscriptions chart displays the number of in-app purchases such as consumables, non-consumables, and non-renewing subscriptions. The chart doesn't include renewable payments. The chart shows the total count of these types of in-app purchases and can help you track user behavior and engagement over time.
Non-subscriptions
For example, if your app records 500 one-time purchases and 1,000 consumable purchases in a week, the Non-subscriptions chart will display a total count of 1,500 purchases for the week. Please note that this chart does not display revenue information.
Trials
Active Trials

The number of trials that are currently active.
New Trials

The number of trials activated.
Trials Renewal Cancelled

The number of trials with cancelled renewal (cancelled by user). When the renewal for the trial is disabled, this means that this trial won't be automatically converted to paid subscription, yet the user still has premium features of the app until the end of the current period.
Expired (Churned) Trials

The number of trials that expired, i.e. the user has no access to the premium features of the app. Usually, it means that the user has decided not to pay for the app or encountered a billing issue.
Issues
Refund Events

The number of refunded purchases and subscriptions.
Refund Money

Amount of money that was refunded. Calculated before store's fee.
Filters
Advanced Analytics provides the following filters.
Countries
Filter metrics by user's store country (if available, otherwise IP country is used).
Products
Filter metrics by product (both subscriptions and one-time purchases are available).
Platforms
Filter metrics by platform (iOS/Android).
A/B tests
Filter metrics by A/B tests that are associated with purchases.
In case your A/B tests have multiple versions, they are marked as "Rev. X" so you can choose the specific one.
Attribution
Filter metrics by Attribution fields like Status, Channel, Campaign, etc.
Updated 8 months ago